Course
Michigan Renewal Bundle – Part 2
Course Highlights
- In this Michigan Renewal Bundle – Part 2 course, we will learn about identifying characteristics of the nurse bully.
- You’ll also learn how to recognize the importance of the many telemetry devices used and identify how these devices impact patient care
- You’ll leave this course with a broader understanding of how to identify and analyze quality improvement opportunities.
About
Contact Hours Awarded: 11
Various Authors.
Begin Now
Read Course | Complete Survey | Claim Credit
➀ Read and Learn
The following course content
Bullying In Nursing
Introduction
In a time when bullying has become one of the most frowned upon behaviors, why is it thriving in the world of nursing? We’ve all heard the saying that “nurses eat their young”. It is a term that has been passed down the nursing ranks as each generation of nurses enters the workplace; unchanged and still true. We, as nurses, cannot permit such unhealthy and detrimental behavior to continue. In this course, we will discuss nurse bullying, why it happens and what we can do to break the curse.
Definitions
To fully understand nurse bullying and the issues that come with it, we must define some terms and phrases so that we are all on the same page.
Nurse Bully
A nurse bully is someone who repeatedly harasses and/or harms other nurses whom they believe they can dominate; they may also see them as less skilled or incompetent (5).
Incivility
Incivility is a type of lower-level bullying that entails more passive types of behavior. This is your mocking, gossiping, alienation, and general rudeness. The difference between incivility and actual bullying is that incivility may not actually harm the victim (6).
Harassment
Harassment is when someone torments or intimidates another person (4).


Self Quiz
Ask yourself...
- What is the difference between incivility and bullying?
- Who is the victim of the nurse bully?
Incidence Rate
The nursing profession has historically been known as the most trusted profession. Nursing is also synonymous with caring and compassion. From the outside looking in, it may be difficult to believe that bullying could exist in such a respected and revered profession. The prevalence of bullying in nursing is staggering. Both new and seasoned nurses; young and old; nurses of every gender; and nurses of every walk of life report that they have been bullied on the job. These instances represent a wide variety of bullying behaviors which include verbal abuse, threatening, scapegoating, sabotage, and physical abuse (5).
Incidence rates of bullying in nursing, as documented in a variety of studies, ranging from 17-85%. This includes incidents of verbal abuse, threatening, belittling, and even physical abuse. With the prevalence of bullying so high among nurses, it is safe to say that virtually every nurse has been touched by bullying, whether victim, perpetrator, or observer (5).
Self Quiz
Ask yourself...
- Does the incident rate of nurse bullying surprise you?
- Have you ever witnessed or been involved in an incident of nurse bullying?
Why Does It Occur?
What drives bullying behaviors? What makes a bully? There are a myriad of factors that come into play when discussing why bullying occurs.
Anger and frustration are two strong emotions that can contribute to bullying behaviors. In today’s nursing work environment, anger and frustration are at the forefront of many nursing units. Nursing shortages have left many units understaffed and the nurses overworked. This frustration leads to anger when the nurses who have remained loyal, full-time staff see travelers come into their areas making higher pay. Lack of resources and the belief that they are unheard of also contribute to feelings of frustration (5).
The belief that another nurse is less competent or altogether incompetent can also lead to bullying. When it is perceived that another nurse can’t do their job and therefore may leave tasks for the oncoming shift, the above-mentioned frustration sets in and bullying may result. Just the feeling of superiority over another nurse can have bullying effects on the nursing environment (1).
Self Quiz
Ask yourself...
- Is there a key risk factor that promotes an environment of nurse bullying?
- Are nurse bullying risk factors real or perceived? Explain.
Risk Factors
There are some circumstances that contribute to the bullying climate. These are not excuses that give permission to the bullies, rather they are risk factors that have been identified as possible catalysts to bullying behaviors.
Seniority
Some nurses may feel that they have “paid their dues” and should have authority over their less-experienced peers. If this authority is not granted, the senior nurse may harbor feelings of underappreciation and lash out by being unhelpful or, to the extreme, harmful. The aim is to show how much this nurse is needed; they will refrain from helping the newer nurse or giving any advice (5).
Insecurity
When new nurses come into the workplace, the existing nurses may feel that they will be replaced. Nursing is an ever-evolving occupation with new technologies and treatments being developed all the time. A new nurse who was taught the most up-to-date trends in nursing may pose a threat to their job. This is when the nurse may start to bully the new nurse joining the team (1).
Protection
Some nurses become very attached to their patients. They may feel that no one else can give the same level of care that they can. As a result, they may see other nurses as incapable of providing care that is up to their standards. Only they can provide the care that their patients require. These perceived inadequacies can quickly turn into bullying behaviors (1).
Education
Differences in levels of education may also contribute to bullying. Nursing has many different levels of education and nurses from all these levels may work together on a single unit. Nurses with higher levels of education may feel superior and lash out at those with less education. RNs may treat LVNs differently than their RN peers (3).
Self Quiz
Ask yourself...
- Name 2 risk factors that contribute to nurse bullying.
- Have these risk factors led to a nurse bullying environment in your organization?
- Does one risk factor stand out to you as a prime contributor to nurse bullying?
- Which one?
Types of Bullying
It is important to note that not every bullying-type behavior can be construed as actual bullying. We all have bad days when things just don’t seem to be going right and we may react inappropriately. One of the key factors that differentiates bullying from a lapse in judgment is that bullying is a repeated or habitual behavior.
This does not excuse the one-time behavior however, we must realize that not all poor behaviors are bullying. Nurse bullying may manifest itself in a variety of different behaviors. Below, we will discuss a few of these types of bullying. This is by no means an exhaustive list of all possible bullying behaviors; they are some of the behaviors that you may commonly see in the healthcare environment (5).
Verbal abuse
This may include being rude, belittling, criticizing, and threatening. We’ve all heard “sticks and stones may break my bones, but words will never hurt me”. This is a false saying as constant verbal abuse plays with our psyche as we rerun the taunts in our heads over and over. If heard enough, we may start to believe the bully’s words.
Controlling
Constantly telling another nurse what to do and how to do it. This is unsolicited advice that if not taken may escalate bullying behaviors. Controlling behaviors may also include certain “looks” and intimidating posturing.
Ignoring/excluding
Ignoring requests for help. Ignoring any suggestions to better provide care to the patients. Excluding that one nurse from lunch plans, work-related activities, or any after-work gatherings.
Assigning heavy workloads
Repeatedly assigning a nurse a heavy workload while everyone else’s load is relatively light. All the other nurses have time to sit and document while the one nurse is overwhelmed.
Physical abuse
Unwanted physical contact is usually violent in nature.
Mobbing
This happens when a group of bullies band together to create an environment to force the victim to resign (2).

Self Quiz
Ask yourself...
- Have you witnessed any of these behaviors at your organization?
- Is there a behavior that is most indicative of nurse bullying?
- What is the key aspect that makes these behaviors acts of bullying?
Characteristics of a Nurse Bully
Nurse bullies come in all shapes and sizes and come from all walks of life. There isn’t necessarily a template for what a nurse bully will look like. However, there are some characteristics that may help identify a nurse bully.
You may encounter a nurse who bullies out of a sense of superiority. They will be condescending and have an entitled attitude. You will also recognize them by their “correcting comments” often spoken where others can hear. Next, we have nurses who bully because they have been offended by something said or done. They bully with an ax to grind. They may hold on to the grudge for a long time. Creating drama with the victim at the center will be their course of action; they will try to pull in other nurses to help ostracize their victim. Other nurse bullies will use rumors and gossip to bully their victim (3)
These bullies love to dish out the put-downs but can’t take any back. They will become offended at the slightest criticism. There are others who will be very friendly at first. Bringing the victim in close to learn details of their lives and then using that information against them. They will weaponize all obtained information to lift themselves up. Another characteristic is envy. There are those bullies who are envious of others. The envy could stem from something totally unrelated to nursing or the workplace. The victim, however, will most likely possess the item or characteristic that the bully is envious of. This bully is very bitter. Finally, there is the bully who plays favorites. They will favor their clique and ignore or exclude the victim (3).
Self Quiz
Ask yourself...
- Do you recognize these characteristics in the nurses you work with?
- Do you see any of these characteristics in you? How will you change?
What Can You Do?
There are many actions that you can take when you are either the witness or victim of nurse bullying. Though some bullies may be intentionally trying to intimidate a fellow nurse, there are those who are oblivious to the fact that they are bullies. They behave like a bully without knowing that they are perceived as such.
The first action that you may want to take is to talk with the bully about the behavior. The bullying may end there. Once it has been brought to the bully’s attention that the behavior is being taken as bullying, change can occur. Communication may be all that is needed (5). Prior to speaking with the bully, try using empathy. Put yourself in the bully’s shoes to figure out what the motive for the behaviors may be. This may aid you in both the tone and direction of the conversation.
Identifying a mentor in the workplace can also help you through a bullying situation. Having someone that you can talk to about the issue and seek their advice about how to handle the situation. Look for those nurses who can’t be bullied. Why do the bullies not prey on them? Why are they not intimidated? Often, these nurses are focused on the patient’s needs above all else and refuse to allow any situation to be about them or the bully (3).
Talking with your manager or director is another prudent course of action. It is possible that these nurse leaders have the best vantage point to deal with and prevent nurse bullying. They work closely with the front-line staff nurses and should have the pulse of the unit. In their position of authority, they are also able to investigate and, if needed, conduct disciplinary actions.
Unless your manager or director is the bully, a meeting with them to discuss any instances of bullying is needed. Contacting the Human Resources department is another step that can be taken. No matter the situation, it is always important to follow your facility’s policies and procedures and chain of command (3).
Self Quiz
Ask yourself...
- What can you do to prevent/stop nurse bullying in your organization?
- What organizational resource should you use to guide your actions?
Solutions to Nurse Bullying
Nurse bullying has repercussions throughout the entire facility. According to a study from 2012, the cost for each individual who is bullied can be from thirty thousand to one hundred thousand dollars (3). This includes the cost of absenteeism, lower work performance, any therapies needed for physical and psychological issues, and increased turnover due to ongoing bullying.
Nurse bullying can also play a big part in the overall feeling of “burnout” among nurses. Nurse bullying can lead to workplace errors which means it is crucial that organizations have strategies to combat any kind of bullying in the workplace. As nursing accounts for the majority of employees at most hospitals, curbing nurse bullying should be in the forefront. Here are some organizational strategies that should be considered:
Culture of Safety
Many organizations have adopted a “Culture of Safety”. The Culture of Safety promotes patient and colleague safety. It is the shared beliefs and values of the organization that influence behaviors and actions. Principles such as non-punitive reporting, communication of policies and expectations, recognition, and leadership modeling of behaviors all come into play in the Culture of Safety. All reports of bullying should be taken seriously (3).
Admit that there is a problem
Like any issue, the first step in fixing it is admitting that the problem exists in the first place. Bullying thrives in the darkness. Once it is brought to light and people are talking about it, it can be addressed. Even if there is no evidence of nurse bullying in your area, talking about and discouraging it may stop it from even starting (3).
Elimination
Try to eliminate factors that promote an environment of bullying.
Commitment
The organization should commit to a zero-tolerance policy when it comes to bullying. The policy on bullying should outline clear expectations along with the consequences that will be enforced if the policy is not followed. The policy should also include the organization’s social and online media sites (3).
Accountability
Nurses should be encouraged to hold each other accountable. You promote what you permit. As there are generally more bullying witnesses than actual bullies, nurses must be empowered to call out bullying. This can lead to a true change in the culture of an organization (3).
Self Quiz
Ask yourself...
- Is your facility currently using any of the above-mentioned strategies?
- How have these strategies mitigated the incidence of nurse bullying in your area?
- Can an organization eliminate nurse bullying?
Conclusion
Nurse bullying is a real problem that can affect any unit in any hospital. It creates a toxic work environment that we, as nurses, can no longer tolerate. In this post-COVID time, nursing shortages and nurse burnout are rapidly depleting the nursing ranks. It is time for nurses to call out bullying when they see it. It is time for nurse leaders to enforce the organizational consequences of nurse bullying.
We must create safe environments for our new nurses (all nurses) to thrive. It is the only way that our profession will survive. Know the signs of nurse bullying and become the change within your organization. Empower your colleagues to do the same. Together, we can see an end to nurse bullying.
Quality Improvement for Nurses
Introduction
Welcome to the world of Quality Improvement (QI) in healthcare, a dedicated field committed to continually enhancing patient care and outcomes. Quality Improvement involves a systematic approach to identify, analyze, and address areas for improvement within healthcare processes, ultimately resulting in improved patient safety, satisfaction, and overall healthcare excellence (13). In this course, we will embark on a journey to explore the fundamental principles and practical applications of QI, explicitly tailored for nurses who aspire to make a positive impact in their healthcare settings.
As a nurse, you know the significance of providing high-quality patient care. However, you may wonder how you can actively contribute to improving the systems and processes in your workplace.
Imagine this scenario: You observe a recurring issue with medication administration, where doses are occasionally missed due to workflow inefficiencies. Through this course, you will acquire the knowledge and skills to apply QI methodologies like Plan-Do-Study-Act (PDSA) cycles to investigate such issues, implement changes, and monitor the impact of your interventions. By understanding QI principles and tools, you will be better equipped to collaborate with your colleagues, drive meaningful improvements, and ensure that your patients receive the best care possible.
Self Quiz
Ask yourself...
- How can nurses leverage their unique position at the bedside to identify opportunities for quality improvement in healthcare settings?
- Can you provide an example from your own experience or knowledge where a quality improvement project led to tangible improvements in patient care?
- What potential challenges could a nurse encounter when attempting to implement quality improvement projects?
What is Quality Improvement?
Quality Improvement (QI) in healthcare represents an ongoing, systematic effort to elevate the quality of patient care and healthcare services that involves identifying areas needing improvement, implementing changes, and evaluating the effects of those changes to ensure better patient outcomes (12).
Let’s envision a scenario where a hospital's surgical department grapples with a higher-than-average rate of post-operative infections. Through a QI initiative, the healthcare team can meticulously scrutinize the surgical processes, pinpoint potential sources of infection, and introduce evidence-based practices such as enhanced sterilization techniques or more rigorous antibiotic prophylaxis protocols. Over time, they can gauge the effectiveness of these changes by monitoring infection rates for a reduction.
Commonly used QI methodologies in healthcare include the DMAIC (Define, Measure, Analyze, Improve, Control) process and the Plan-Do-Study-Act (PDSA) cycle. These approaches provide structured frameworks for healthcare professionals to tackle issues systematically and iteratively. For example, imagine a bustling primary care clinic with extended patient wait times.
Here, the PDSA cycle can come into play using the systematic iterative steps below:
- The team defines the problem (lengthy wait times)
- The team proceeds to test a change (for example, adjusting appointment scheduling)
- The team then scrutinizes the results and acts accordingly to refine the process.

Self Quiz
Ask yourself...
- How does the concept of Quality Improvement (QI) align with the goal to provide the best possible care for patients?
- Can you think of a specific healthcare scenario where QI methodologies like DMAIC or PDSA could significantly improve patient care?
- What are the advantages of using structured frameworks like DMAIC and PDSA in QI initiatives?
- How do DMAIC or PDSA contribute to the success of improvement projects?
History and Background of Quality Improvement
The history and background of Quality Improvement (QI) in healthcare have a rich and evolving timeline, dating back to the early 20th Century, with significant developments occurring over the years. One pivotal moment in this journey was the introduction of statistical quality control by Dr. Walter A. Shewhart in the 1920s (24). Dr. Shewhart's pioneering work laid the foundation for using statistical methods to monitor and enhance processes, a concept that would become integral to QI initiatives (24).
In the mid-20th Century, the contributions of Dr. W. Edwards Deming further propelled QI principles forward (7). Dr. Deming emphasized the significance of continuous improvement, active employee engagement, and process variability reduction. His ideas found fertile ground in post-World War II Japan, playing a crucial role in the nation's economic recovery and the emergence of renowned companies like Toyota, famous for its Toyota Production System (TPS), incorporating QI concepts (7).
Until today, QI has become indispensable to healthcare systems worldwide (16). To illustrate, envision a scenario where a hospital grapples with a high readmission rate among heart failure patients. By scrutinizing historical data and implementing evidence-based protocols for post-discharge care, hospitals can effectively lower readmissions, enhance patient outcomes, and potentially evade financial penalties under value-based reimbursement models (16).
Self Quiz
Ask yourself...
- How did the work of Dr. Walter A. Shewhart in the early 20th Century contribute to the foundation of QI, and how do statistical methods continue to play a role in healthcare improvement today?
- What fundamental principles were introduced by Dr. W. Edwards Deming, and how did they influence QI practices in healthcare and other industries?
- Can you provide an example of how QI methodologies, inspired by Deming's principles, have been successfully applied in modern healthcare settings to address specific challenges or improve patient care?
- How has continuous improvement evolved, and why is it considered a cornerstone of QI in healthcare?
Models
At the heart of ongoing transformations in healthcare lies various Quality Improvement (QI) models. These models provide structured frameworks for identifying and addressing areas of improvement within healthcare systems (14). These models offer healthcare professionals a systematic approach to instigate meaningful process changes, ultimately resulting in elevated care quality. See some models below.

Model for Improvement
The Model for Improvement is a widely recognized and highly effective framework for Quality Improvement (QI) in healthcare. This is because it empowers healthcare professionals to systematically test and fine-tune their ideas for process improvement, ensuring that changes are grounded in evidence and proven effective (17).
The Model for Improvement offers a structured and systematic approach to identifying, testing, and implementing changes to enhance healthcare processes and ultimately elevate patient outcomes.
Developed by Associates in Process Improvement (API), this model revolves around the iterative "Plan-Do-Study-Act" (PDSA) cycle, which forms the foundational structure of QI initiatives (17). The Plan-Do-Study-Act (PDSA) cycle is a systematic approach that guides healthcare teams through quality improvement, and it comprises the four key phases below, each contributing to developing and implementing meaningful changes in healthcare practices (12).
- Plan: In this initial phase, healthcare teams define the specific problem they aim to address, set clear and measurable goals, and craft a comprehensive plan for implementing the proposed change. For instance, if a hospital seeks to reduce patient wait times in the emergency department, the plan may involve adjustments to triage protocols or streamlining documentation processes.
- Do: Once the plan is established, the proposed change is implemented, typically on a small scale or within a controlled or pilot environment. This enables healthcare professionals to assess the feasibility and potential impact of the change without making widespread adjustments.
- Study: The study phase involves rigorous data collection and analysis to evaluate the effects of the change. In our example, the hospital would measure the impact of the new triage protocols on wait times, closely examining whether they have decreased as expected.
- Act: Based on the findings from the study phase, the healthcare team makes informed decisions about the change. They may adopt the change if it has successfully reduced wait times, adapt it further for enhanced effectiveness, or, if necessary, abandon it.
The PDSA cycle's iterative nature means adjustments can be made, and the cycle repeats until the desired improvement is achieved (12).
Lean Model
The Lean model, initially conceived in the manufacturing sector, has found considerable success and applicability in healthcare as a potent tool for process enhancement and waste reduction (22). At its core, Lean thinking revolves around the principles of efficiency and value optimization because it focuses on refining processes to eliminate wasteful elements while simultaneously delivering care of the highest quality (22).
Healthcare organizations have adopted Lean methodologies to tackle many challenges, from reducing patient wait times to improving inventory management and elevating overall patient satisfaction (22). For instance, when a hospital is challenged with prolonged wait times in its outpatient clinic, it can apply Lean principles to systematically analyze the patient flow, pinpoint bottlenecks, and streamline processes.
This might involve reconfiguring furniture to enhance flow, adjusting appointment scheduling, or implementing standardized work procedures. The ultimate objective is to cultivate a patient-centric, efficient environment that ensures timely access to care while meticulously conserving time and resources.
Another integral aspect of Lean thinking is the unwavering commitment to continuous improvement and the pursuit of perfection through the systematic identification and eradication of various forms of waste (19). The forms of waste are often categorized into seven types: overproduction, waiting, unnecessary transportation, overprocessing, excess inventory, motion, and defects (19). By keenly identifying and addressing these forms of waste, healthcare organizations not only enhance the utilization of resources but also curtail costs and elevate the overall quality of care delivery.
Six Sigma model
The Six Sigma model is a robust and widely adopted healthcare method for improving processes and reducing mistakes (9). It was first used in manufacturing but is now used in healthcare to make processes more consistent and improved by finding and fixing mistakes and inefficiencies (9).
An example is when a hospital is concerned about the accuracy of medication dosing for pediatric patients, a Six Sigma team might include: indicating the problem, gathering data on mistakes regarding dosing, and finding out why the mistakes happened. The strategy may encompass the implementation of standardized dosing protocols, refining staff training programs, and closely monitoring the medication administration process to ensure that mistakes are eliminated.
Six Sigma uses a framework called DMAIC (Define, Measure, Analyze, Improve, Control) to make improvements. This framework utilizes data-driven tools to discern problems, quantify their origins, develop practical solutions, and institute control mechanisms to sustain improvements (11). Through this systematic journey, healthcare organizations position themselves to deliver care of elevated quality, curtail costs, and bolster patient safety.
TeamSTEPPS model
TeamSTEPPS, which stands for Team Strategies and Tools to Enhance Performance and Patient Safety, is a teamwork and communication model designed explicitly for healthcare settings (4). Developed by the U.S. Department of Defense and the Agency for Healthcare Research and Quality (AHRQ), TeamSTEPPS focuses on improving patient safety by enhancing team collaboration, communication, and decision-making among healthcare professionals (4).
One key element of TeamSTEPPS is using structured communication techniques to prevent errors and misunderstandings. For instance, during patient handoffs from one healthcare provider to another, TeamSTEPPS emphasizes using a structured tool like SBAR (Situation, Background, Assessment, Recommendation) to convey critical information succinctly and accurately. This ensures that essential patient details are noticed, reducing the risk of adverse events (18).
In a surgical team scenario, TeamSTEPPS principles can be applied to improve teamwork and communication among surgeons, nurses, and anesthesiologists. The model encourages briefings before procedures to set clear objectives, huddles during surgery to address emerging issues, and debriefings afterward to reflect on the process and identify areas for improvement. By fostering a culture of open communication and mutual respect, TeamSTEPPS contributes to safer, more efficient healthcare delivery (4).

Self Quiz
Ask yourself...
- How can healthcare organizations determine which QI model suits their specific challenges or improvement goals?
- How do QI models emphasize data collection and analysis, and why is this critical in healthcare?
- Can you imagine a real-world scenario where the Lean Six Sigma framework can successfully improve healthcare processes and outcomes?
- What are some emerging trends or innovations in QI models and methodologies, and how might they shape the future of healthcare quality improvement?
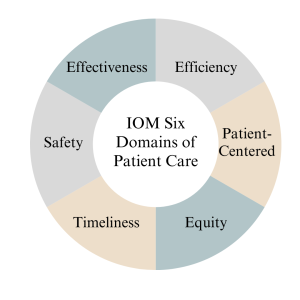
IOM Six Domains of Patient Care
The Institute of Medicine (IOM), now known as the National Academy of Medicine, introduced the Six Domains of Quality in Healthcare as a framework to assess and improve the quality of patient care (14). These domains, introduced in 2001, encompass various aspects of care delivery and patient experience, helping healthcare organizations and providers identify areas for improvement (14). The domains serve as pillars for assessing the different dimensions of care delivery, ensuring that healthcare organizations and providers address the holistic needs of patients (14).
Definitions
The Six Domains of Patient Care are essential for providing high-quality healthcare. See definitions of each of the IOM's six domains of patient care below.
- Safe: Safety is the foundational domain, emphasizing the importance of reducing the risk of patient harm. This includes preventing medical errors, preventing infections, and ensuring the safe administration of medications. Healthcare organizations implement safety protocols and engage in continuous monitoring to minimize risks (14).
- Effective: Effective care ensures that patients receive evidence-based treatments and interventions that result in the desired outcomes. It involves using the best available scientific knowledge to make informed decisions about patient care avoiding unnecessary or ineffective treatments (14).
- Patient-Centered: Patient-centered care focuses on individualizing healthcare to meet each patient's unique needs and preferences. It involves respecting patients' values and preferences, engaging them in shared decision-making, and delivering care with empathy and compassion (14).
- Timely: Timely care emphasizes reducing delays in healthcare delivery. It includes providing care promptly and avoiding unnecessary waiting times for appointments, tests, and treatments. Timely care is especially critical in emergencies (14).
- Efficient: Efficiency in healthcare means maximizing resource utilization and minimizing waste while providing high-quality care. This domain emphasizes streamlining processes, reducing unnecessary costs, and optimizing healthcare resources (14).
- Equitable: Equitable care underscores the importance of providing healthcare that is fair and just, regardless of a patient's background, socioeconomic status, or other factors. It aims to eliminate healthcare access and outcomes disparities among different patient populations (14).
Measures
Measures in the context of the Institute of Medicine (IOM) six domains of patient care refer to the metrics and indicators used to assess and evaluate the quality of care provided in each domain. According to (14), the measures below are essential for monitoring and improving healthcare services. See details below.
- The "Safe" domain measures focus on tracking and reducing adverse events and medical errors. Key indicators include rates of medication errors, hospital-acquired infections, falls, and complications from procedures. Safety measures also assess the implementation of safety protocols, such as hand hygiene compliance and patient identification bracelets.
- Measures in the "Effective" domain assess how evidence-based practices and treatments are utilized. These measures include adherence to clinical guidelines, appropriate use of medications, and the success rates of medical interventions. Additionally, outcomes such as patient recovery, remission, or improvement are indicators of the effectiveness of care.
- The "Patient-Centered" domain focuses on assessing the patient’s experience and satisfaction with care. Patient surveys and feedback are standard measures, evaluating aspects like communication with healthcare providers, involvement in decision-making, and overall satisfaction with the care received. Healthcare organizations also measure shared decision-making and respect for patient preferences.
- Measures related to the "Timely" domain evaluate the efficiency of healthcare delivery. Key metrics include waiting times for appointments, diagnostic tests, and procedures. Additionally, measures track the timely delivery of urgent care and the avoidance of unnecessary delays in treatment.
- Efficiency measures aim to quantify resource utilization and the reduction of waste in healthcare. Metrics may include the cost of care per patient, length of hospital stays, and resource allocation efficiency. Improvement in resource utilization and cost-effectiveness are vital indicators of efficiency.
- Measures within the "Equitable" domain assess disparities in healthcare access and outcomes among different patient populations. Healthcare utilization and outcomes data are stratified by demographics, socioeconomic status, race, and ethnicity to identify and address inequities. Key indicators include access to preventive care, healthcare utilization rates, and health outcomes across various demographic groups.
Self Quiz
Ask yourself...
- How can healthcare providers ensure their care aligns with patients' values, preferences, and cultural backgrounds?
- What challenges might patients face in accessing healthcare services, and how can healthcare organizations improve access for all patients?
- What are the potential consequences of poor care coordination among healthcare providers, and how can interdisciplinary teams work together to enhance coordination?
- Why must healthcare organizations continually assess and improve the quality of care they provide, and what mechanisms can be implemented to support ongoing improvement efforts?
Nursing Quality Indicators
According to (5), nursing quality indicators are essential metrics used to evaluate and improve the quality of nursing care in healthcare settings. These indicators provide valuable insights into nursing practice and patient outcomes, helping healthcare organizations and nursing staff deliver safe, effective, patient-centered care. Let's delve into some key nursing quality indicators and their significance below.
Patient Falls
Patient falls are a critical quality indicator in nursing care since they can result in severe injuries and complications for patients (5). As a result, healthcare organizations measure and monitor the rate of patient falls to identify trends and implement preventive measures.
For example, when a hospital notices an increase in the rate of falls among elderly patients in a particular unit, they may introduce interventions such as nonslip flooring, improved lighting, and patient education as fall prevention strategies to reduce the incidence of falls.

Medication Administration Errors
Ensuring accurate medication administration is crucial in nursing practice because medication errors can lead to adverse events, including patient harm or death (5). Nursing quality indicators related to medication administration errors include the rate of medication errors and adherence to medication reconciliation processes (5). For instance, nurses are encouraged to verify patient allergies and cross-check medication orders to prevent errors. If there is an increase in medication errors in a healthcare facility, it may prompt a review of medication administration protocols and additional staff training.

Pressure Ulcers (Bedsores)
Pressure ulcers are a quality indicator of patient skin integrity since they develop when patients remain immobile for extended periods (5). As a result, healthcare organizations measure the incidence and prevalence of pressure ulcers as an indicator of the quality of nursing care (5).
Patient Satisfaction
Patient satisfaction is a patient-centered nursing quality indicator since it reflects the overall patient experience and perception of care (5). Surveys and feedback mechanisms are used to measure patient satisfaction. For example, a scenario might involve patients receiving post-discharge surveys that assess various aspects of their hospital experience, including nurse responsiveness, communication, and pain management. Healthcare organizations can use this feedback to identify areas for improvement and enhance patient-centered care.
In summary, nursing quality indicators encompass a range of metrics that evaluate nursing care quality, patient safety, and patient experiences. By monitoring and responding to these indicators, healthcare organizations and nursing staff can continuously improve their quality of care, leading to better outcomes and increased patient satisfaction (5).
Self Quiz
Ask yourself...
- Why is data collection critical in nursing quality improvement efforts?
- What types of data should nurses prioritize collecting to assess patient safety?
- How can nurses ensure the accuracy and reliability of the data they collect for quality improvement purposes?
- What challenges might nurse face when collecting patient-related data, and how can these challenges be overcome?
Data Collection
Quality improvement data collection is a critical component of healthcare quality initiatives, providing the necessary information to assess the current state of care, identify areas for improvement, and monitor progress over time (2). Accurate and meaningful data collection enables healthcare organizations to make informed decisions, implement evidence-based interventions, and ultimately enhance patient outcomes. Let's explore the methods of data collection below.
- Clinical Outcome Collection: Clinical outcome data collection is essential for assessing the effectiveness of healthcare interventions (2). For example, consider a scenario where a hospital is implementing a quality improvement project to reduce surgical site infections (SSIs) following orthopedic surgeries. Data collection would involve tracking the number of SSIs occurring over a specific period and collecting information on patient characteristics, surgical techniques, and post-operative care protocols. By analyzing this data, the healthcare team can identify trends, risk factors, and areas for improvement, ultimately leading to targeted interventions to reduce SSIs.
- Patient Satisfaction Survey Data Collection: Patient satisfaction surveys are valuable tools for collecting data on patient experience (2). A primary care clinic that aims to improve patient satisfaction may administer surveys to patients after each visit, asking about aspects of care such as communication with healthcare providers, wait times, and overall experience. The collected data can reveal areas of strength and areas requiring improvement. For instance, if survey results consistently indicate longer-than-desired wait times, the clinic can adjust scheduling practices or implement strategies to reduce wait times and enhance patient satisfaction.
- Process Measures Data Collection: Process measure data collection focuses on evaluating the efficiency and effectiveness of healthcare processes (2). For instance, in a medication reconciliation scenario, a healthcare organization might collect data on the accuracy and completeness of medication lists during care transitions. By tracking the frequency of medication reconciliation discrepancies, they can identify process inefficiencies and implement standardized protocols for reconciliation, leading to safer care transitions and reduced medication errors.
- Adverse Event Reporting Data Collection: Adverse event reporting is a crucial mechanism for collecting data on incidents that result in patient harm or near misses (2). For example, consider a scenario where a nurse administers the wrong medication dose to a patient but catches the error before any harm occurs. Reporting this near-miss event allows the healthcare organization to investigate the root causes, implement preventive measures, and share lessons learned with the care team to prevent similar incidents in the future.
Types of Data
Data types play a crucial role in understanding the current state of care, identifying areas for improvement, and implementing evidence-based interventions (2). Let’s explore the different types of data used in quality improvement below.
- Quantitative Data: Quantitative data involves numerical measurements and is particularly useful for assessing the frequency and extent of specific events or outcomes (2). For instance, in a hospital's quality improvement project focused on reducing hospital-acquired infections, the team collects quantitative data on the number of infections over time, allowing them to track trends and measure the impact of interventions, such as hand hygiene protocols or disinfection practices.
- Qualitative Data: Qualitative data provides insights into the "why" and "how" behind healthcare processes and patient experiences (2). This data type is collected through interviews, focus groups, and open-ended surveys. For example, in a primary care setting aiming to improve patient satisfaction, qualitative data may be collected through patient interviews to gather in-depth information about their perceptions of care. Qualitative data can uncover nuances and provide valuable context to complement quantitative findings (2).
- Patient-Reported Data: Patient-reported data includes information directly provided by patients about their health, symptoms, experiences, and preferences. Patient-reported outcome measures (PROMs) and patient-reported experience measures (PREMs) are standard data collection tools. In a scenario involving chronic disease management, patients with diabetes may be asked to complete a PROM assessing their quality of life and symptom management. This data helps healthcare providers tailor care plans to individual patient needs and preferences (2).
- Process Data: Process data track the steps and activities involved in healthcare delivery to help assess the efficiency and effectiveness of care processes. For example, in a surgical quality improvement initiative, process data may include the time from patient admission to surgery, surgical team checklist completion, and adherence to anesthesia protocols. By collecting and analyzing process data, healthcare organizations can identify bottlenecks and areas for improvement in care delivery processes.
In summary, quality improvement data collection relies on various data types, including quantitative, qualitative, patient-reported, and processed data. Each data type contributes to a comprehensive understanding of healthcare quality and supports evidence-based decision-making to enhance patient care and outcomes.

Identification Stage
The identification stage for quality improvement data collection is a critical initial phase where healthcare organizations and teams define what data to collect, why it is relevant, and how it aligns with their quality improvement goals (23). This stage is essential for ensuring meaningful data collection efforts will lead to actionable insights. Let's explore the identification stage in more detail.
- Defining Objectives and Goals: During this stage, healthcare organizations must clearly define the objectives and goals of their quality improvement initiative (23). For instance, a hospital aiming to reduce readmission rates for heart failure patients may set a specific goal of reducing readmissions by 20% within the following year.
- Selecting Relevant Metrics: Identifying the right metrics and data points is crucial, and organizations should choose metrics that directly relate to their quality improvement goals (23). Continuing with the example of reducing heart failure readmissions, relevant metrics might include the number of heart failure patients readmitted within 30 days, the reasons for readmission, and patient characteristics. By selecting these metrics, the organization ensures that data collection efforts are aligned with their specific improvement goal.
- Determining Data Sources: Healthcare organizations must identify where the necessary data will be sourced (23). This may involve looking at electronic health records, claims data, patient surveys, or other sources. For instance, to collect data on heart failure readmissions, the hospital may extract relevant information from electronic health records, including admission and discharge dates, diagnosis codes, and patient demographics.
- Creating Data Collection Protocols: Establishing clear data collection protocols is essential for consistency and reliability (23). Healthcare teams should define how data will be collected, who will be responsible for data collection, and the frequency of data collection. For example, in a hospital project aiming to improve hand hygiene compliance, data collection protocols might specify that trained observers will monitor hand hygiene practices at random intervals and record their findings on standardized forms.
By carefully navigating the identification stage, healthcare organizations ensure that their quality improvement data collection efforts are purposeful and aligned with their goals. This sets the stage for collecting meaningful data to drive evidence-based decisions and interventions to enhance healthcare quality.
Gathering Stage
The gathering stage of quality improvement data collection is crucial for healthcare organizations to collect the identified data based on their quality improvement objectives and goals (23). This stage involves systematically collecting data from various sources and often requires careful planning and coordination to ensure data accuracy and completeness. Let's delve into the gathering stage in detail below.
- Data Collection Methods: To gather data, healthcare organizations must determine the most suitable methods for collecting the identified data, which may involve a combination of electronic health records, patient surveys, direct observations, and administrative databases (23). For example, in a quality improvement project aimed at reducing hospital readmissions, data may be collected by reviewing electronic health records to track patient outcomes, conducting patient surveys to gather feedback on discharge instructions, and analyzing administrative data to identify trends in readmission rates.
- Ensuring Data Accuracy and Consistency: Data accuracy is critical in the gathering stage, and organizations must implement procedures to collect data consistently and without errors (23). For instance, if a healthcare facility is collecting data on medication administration, nurses may use standardized protocols to accurately record medication administration times and doses. Regular training and quality checks may also be implemented to maintain data accuracy.
- Timely Data Collection: Timeliness is another important aspect of the gathering stage, and data should be collected promptly to ensure it is current and relevant for analysis and decision-making (23). In a scenario involving tracking patient outcomes, healthcare teams may set specific intervals for data collection, such as collecting post-surgical complication data daily or weekly, depending on the project's requirements.
- Data Security and Privacy: Protecting patient data is a paramount concern in healthcare. As a result, healthcare organizations must adhere to strict privacy and security protocols during the gathering stage to ensure that patient information is handled confidentially and complies with applicable laws and regulations, such as the Health Insurance Portability and Accountability Act (HIPAA) (23). For example, when collecting patient-reported data, organizations may anonymize responses to protect patient identities and comply with privacy regulations.
By effectively managing the gathering stage, healthcare organizations can ensure that they collect accurate, timely, and secure data that will serve as the foundation for subsequent analysis and quality improvement efforts.
Analysis stage
The analysis stage for quality improvement data collection is a critical phase where collected data is processed, examined, and transformed into actionable insights. This stage involves various analytical techniques and tools to identify patterns, trends, and areas for improvement (2). Let's explore the analysis stage in detail below.
- Descriptive Analysis: Descriptive analysis is the initial step in data analysis, focusing on summarizing and presenting data meaningfully (2). For example, in a quality improvement project aimed at reducing patient wait times in an emergency department, an analysis may involve calculating and displaying key statistics, such as average wait times, 95th percentile wait times, and the distribution of wait times (2). These descriptive statistics provide an overview of the current situation and help identify areas that need attention.
- Root Cause Analysis (RCA): Root cause analysis is a critical aspect of the analysis stage, as it helps pinpoint the underlying causes of issues or problems (2). In our scenario, if the analysis reveals prolonged wait times in the emergency department, RCA may involve a thorough investigation into the factors contributing to the delays. Potential root causes include staffing shortages, inefficient triage processes, or bottlenecks in diagnostic testing. Identifying these root causes is essential for developing effective interventions.
- Statistical Analysis: Statistical analysis plays a vital role in quality improvement by examining the relationships between variables and testing hypotheses (2). In reducing hospital readmissions, statistical analysis may be used to identify factors associated with readmission risk. For example, healthcare teams can use logistic regression to analyze patient data to determine which variables, such as comorbidities or medication adherence, are statistically significant predictors of readmission risk. This information can guide the development of targeted interventions for at-risk patients.
- Benchmarking: Benchmarking involves comparing an organization's performance data with industry standards or best practices to identify performance gaps (2). When a hospital is looking to improve patient satisfaction, benchmarking may involve comparing its patient satisfaction scores to those of similar hospitals or national averages. Identifying areas where the hospital falls behind benchmarks can inform strategies for improvement, such as implementing best practices from higher-performing institutions.
The analysis stage is critical for transforming raw data into actionable insights and understanding healthcare quality factors (2). Through descriptive analysis, root cause analysis, statistical techniques, and benchmarking, healthcare organizations can gain valuable insights that drive evidence-based decisions and interventions to improve care quality (6).
Benchmarking
The benchmarking stage in quality improvement data collection is a crucial phase where healthcare organizations compare their performance against established benchmarks or best practices (1). This gives healthcare organizations a clear understanding of their position relative to recognized standards and allows them to effectively identify areas for improvement, prioritize, and focus their improvement efforts (5). Let's delve into the benchmarking stage in detail below.
- Defining Benchmarks: In the benchmarking stage, healthcare organizations must define the benchmarks or standards against which they will measure their performance. These benchmarks can be internal (comparing current performance to historical data) or external (comparing to industry standards, best practices, or similar organizations) (1). For example, a primary care clinic seeking to improve appointment scheduling efficiency may choose to benchmark its appointment wait times against industry benchmarks for acceptable wait times.
- Collecting Comparative Data: Gathering data that allows for a meaningful comparison is critical in benchmarking, so healthcare organizations must collect data from relevant sources to measure their performance against the chosen benchmarks (1). Continuing with the appointment scheduling example, the clinic may collect data on the time it takes to schedule an appointment, the number of scheduling errors, and patient feedback. This data is then compared to industry benchmarks or best practices.
- Identifying Performance Gaps: The benchmarking process reveals gaps or disparities between an organization's performance and the benchmarks to highlight improvement areas (1). For instance, if the clinic discovers that its appointment wait times are significantly longer than industry benchmarks, this identifies a performance gap that needs to be addressed to enhance patient access and satisfaction.
- Developing Improvement Strategies: Healthcare organizations can develop targeted improvement strategies once performance gaps are identified. These strategies are based on evidence from the benchmarking process and aim to align performance with or exceed established benchmarks (1). In our scenario, the clinic may implement strategies such as optimizing appointment scheduling processes, enhancing staff training, or using technology to improve scheduling efficiency.

Self Quiz
Ask yourself...
- Why is data collection a crucial step in the quality improvement process?
- What types of data are typically collected during the data collection stage of quality improvement?
- How do you determine which data points are relevant to your quality improvement project?
- What methods and tools can be used to collect data accurately and efficiently?
Change Models in Healthcare
Change models are essential frameworks used in healthcare, including nursing, to guide and manage the effective implementation of quality improvement initiatives (15). These models offer structured approaches to initiate, plan, execute, and sustain changes in healthcare practice (15). Let’s discuss some prominent change models used in nursing quality improvement below.
- Kotter's 8-Step Change Model: Developed by Dr. John Kotter, this model emphasizes the importance of creating a sense of urgency, building a guiding coalition, and sustaining the change (15). For instance, in a nursing scenario focused on reducing hospital-acquired infections, the 8-step model would involve creating urgency by highlighting the impact of infections on patient safety, assembling a coalition of nurses and infection control specialists, and sustaining change by monitoring infection rates over time and continually reinforcing hygiene protocols.
- Lewin's Change Management Model: Lewin's model consists of three stages: unfreezing, changing, and refreezing (15). Let's consider implementing a new electronic health record (EHR) system in nursing. Nurses first "unfreeze" by acknowledging the need for a new system and undergoing training. Then, they "change" by adopting the EHR and adjusting workflows. Finally, they "refreeze" by becoming proficient and maintaining the new system's use as a standard practice.
- PDSA Cycle (Plan-Do-Study-Act): This model emphasizes iterative cycles of planning, implementing, observing, and adjusting (15). For instance, if a nursing unit aims to improve patient handoffs, they might "plan" by identifying handoff best practices, "do" by implementing changes, "study" by assessing the impact on patient outcomes, and "act" by making further refinements based on their findings. This continuous cycle allows for gradual, data-driven improvements.
- ADKAR Model: The ADKAR model focuses on individual change management, and this could apply to a scenario where nurses are adopting new pain management protocols (15). Nurses would first need awareness of the change (A), followed by desire (D) to participate, knowledge (K) of how to implement the new protocols, ability (A) to do so, and reinforcement (R) to sustain the change over time.
In summary, change models provide structured approaches to drive quality improvement initiatives in nursing, and by applying these models, nurses and healthcare organizations can systematically plan, implement, and evaluate changes to enhance patient care, safety, and outcomes (15).
Self Quiz
Ask yourself...
- Why are change models essential in nursing quality improvement initiatives?
- What is the primary purpose of creating a sense of urgency in change models like Kotter's 8-Step model?
- How does Lewin's Change Management Model address the need to "unfreeze" existing practices in nursing before implementing change?
- Why is individual change management crucial in nursing practice, as the ADKAR model emphasizes?
Implementing Change
Implementing changes for quality improvement in nursing is a multifaceted process that requires careful planning, effective communication, and the engagement of healthcare professionals at all levels. According to (15), successful implementation ensures that desired changes are integrated into daily nursing practice, improving patient outcomes. Let’s explore key strategies and considerations for implementing changes in nursing quality improvement below.
- Engage Interdisciplinary Teams: According to (15), collaborative engagement is crucial when implementing changes in nursing practice, and healthcare organizations should assemble interdisciplinary teams that include nurses, physicians, administrators, and other stakeholders. For example, in a scenario involving the adoption of a new pain management protocol, nurses can collaborate with physicians to ensure the consistent application of evidence-based pain management practices. This team approach facilitates a shared understanding of the change and fosters buy-in from all parties.
- Effective Communication: Clear and consistent communication is essential during the implementation phase, so nurses should communicate the rationale behind the change, its expected benefits, and the specific steps involved (15). For example, suppose a hospital is transitioning to a new electronic health record system. In that case, nurses can attend training sessions to understand its features and communicate effectively with patients about how it will enhance their care. This ensures that all stakeholders are informed and can adapt to the change seamlessly.
- Training and Education: Providing adequate training and education is critical to equip nursing staff with the knowledge and skills to implement the change effectively (15). In the case of introducing a new wound care protocol, nurses would require training on the updated practices, wound assessment techniques, and the use of new wound care products. In addition to initial training, ongoing education would ensure that nursing staff stay current with best practices to provide quality care confidently.
- Continuous Monitoring and Feedback: According to (15), implementing change is an ongoing process that requires constant monitoring and feedback since feedback mechanisms allow for adjustments and refinements to the change process. As a result, nursing quality improvement initiatives benefit from the regular collection and analysis of data to assess the impact of the change. For example, suppose a hospital introduces a sepsis screening tool. In that case, nurses can track the number of patients screened, identify missed cases, and evaluate whether early interventions have reduced sepsis-related mortality rates. By engaging interdisciplinary teams, fostering effective communication, providing training and education, and implementing continuous monitoring and feedback mechanisms, nurses can successfully implement changes that improve the quality of patient care and enhance overall healthcare outcomes (8).
Self Quiz
Ask yourself...
- Why is it crucial for nursing teams to engage in interdisciplinary collaboration when implementing changes for quality improvement?
- How can effective communication strategies help nursing staff understand the purpose and benefits of a proposed change in healthcare practice?
- What role does ongoing training and education play in ensuring that nursing staff are well-prepared to implement and sustain changes in their practice?
- What methods can be employed to gather feedback from nursing staff while implementing a new practice or protocol?
Evaluating Change
Evaluating change for quality improvement in nursing is a critical phase that involves assessing the impact and effectiveness of implemented changes on patient care outcomes, safety, and the overall quality of healthcare services. According to (15), rigorous evaluation ensures that improvements are sustained, and necessary adjustments are made. Let’s explore key strategies and considerations for evaluating changes in nursing quality improvement below.
- Establishing Clear Evaluation Metrics: To evaluate change effectively, it is essential to define clear and measurable evaluation metrics, and according to (15), these metrics should align with the specific objectives of the change initiative. For example, suppose a nursing unit has introduced a new hand hygiene protocol to reduce hospital-acquired infections. In that case, evaluation metrics may include the number of infections before and after the change, adherence to hand hygiene guidelines, and patient satisfaction scores related to cleanliness and infection prevention.
- Data Collection and Analysis: Data collection is a fundamental component of the evaluation process, and nursing teams should collect relevant data using standardized methods and tools (15). In our scenario, data on infection rates can be collected regularly, and statistical analysis can be performed to determine whether the change has had a statistically significant impact. Nurses can then use run charts or control charts to visualize trends in infection rates over time, allowing for early detection of any potential issues.
- Patient and Staff Feedback: Patient and nursing staff feedback is invaluable in evaluating change since patients' perspectives on the quality of care and their experiences following the change can provide insights into the initiative's effectiveness (15). Additionally, nursing staff can provide feedback on the practicality and feasibility of the new practices. For instance, nursing staff may suggest further improvements in infection control procedures.
- Sustainability and Continuous Improvement: Evaluating change is not solely about assessing immediate outcomes but also ensuring sustainability and continuous improvement. According to (15), nursing teams should determine whether the positive effects of the change are maintained over time and whether there is room for further refinement. For example, when a nursing unit has reduced infection rates, regular audits and monitoring should continue to ensure sustained compliance with hygiene protocols.
Self Quiz
Ask yourself...
- Why must nursing teams establish clear and measurable evaluation metrics when assessing the impact of change in healthcare practice?
- How can nurses effectively collect and analyze data to evaluate the success of a change in their nursing practice?
- What role does patient feedback play in evaluating the impact of a change on the quality of nursing care, and how can this feedback be gathered and utilized?
- How can nursing staff engage in ongoing self-assessment to determine their practice changes' effectiveness and identify improvement areas?
Self Quiz
Ask yourself...
- What specific infection prevention measures should nurses prioritize in their daily practice to reduce hospital-acquired infections, and why are these measures effective?
- What are the primary goals of a quality improvement project to reduce hospital-acquired infections, and how can nursing staff contribute to achieving these goals?
- Why is continuous monitoring and evaluation crucial in quality improvement projects, and how can nursing staff use data to drive ongoing improvements in patient care quality?
- Enhancing Medication Safety: Medication errors can have severe consequences for patients (6). A quality improvement project may target medication safety by introducing barcode scanning systems for medication administration, implementing double-check procedures for high-risk medications, and providing ongoing training to nursing staff. The project's effectiveness can be assessed by monitoring the number of medication errors reported and verifying that the new safety measures reduce the occurrence of such errors. For example, a nursing team could reduce the incidence of wrong-patient medication administration by implementing barcode scanning during medication administration.
Self Quiz
Ask yourself...
- How can nurses ensure that barcode scanning systems and double-check procedures are effectively integrated into their daily workflow in medication safety improvement projects?
- What potential challenges and barriers can nurse units encounter when implementing medication safety improvements, and how can these challenges be addressed?
- Improving Nurse-to-Patient Ratios: Adequate nurse staffing levels are crucial for patient safety and quality of care (6). A quality improvement project may involve adjusting nurse-to-patient ratios based on patient acuity levels, introducing workload management tools, and conducting regular staffing needs assessments. In this case, the project's success can be measured by tracking patient outcomes, nurse workload, and patient satisfaction scores. For example, a nursing unit could reduce nurse burnout and improve patient care by optimizing staffing ratios during peak hours.
Self Quiz
Ask yourself...
- Why is it important to regularly assess and adjust nurse-to-patient ratios in a healthcare setting, and what strategies can nurse leaders employ to optimize staffing levels?
- In a quality improvement project focused on nurse-to-patient ratios, what key factors should nurse leaders consider when determining staffing needs during different shifts and patient acuity levels?
- Enhancing Discharge Planning and Care Transitions: Effective care transitions from the hospital to home or other healthcare settings are essential to preventing readmissions and ensuring continuity of care (6). A quality improvement project may focus on improving the discharge planning process, including patient education, medication reconciliation, and post-discharge follow-up. Success can be assessed by monitoring readmission rates and patient-reported experiences. For example, a nursing team could work on reducing hospital readmissions by ensuring that patients receive thorough discharge instructions and have access to follow-up care.
Self Quiz
Ask yourself...
- What steps can nurse teams take to enhance the discharge planning process and ensure seamless care transitions for patients moving from the hospital to home care?
- What strategies can nurse teams employ to ensure that patient education during discharge planning is effective and leads to better patient outcomes and satisfaction?
The above examples illustrate the diverse range of quality improvement projects in nursing, each addressing specific challenges to enhance patient safety and care quality.
Self Quiz
Ask yourself...
- Why is continuous monitoring and evaluation crucial in quality improvement projects, and how can nursing staff use data to drive ongoing improvements in patient care quality?
- What are the primary goals and objectives of QI models, and how do they contribute to the overall quality of healthcare?
Conclusion
In conclusion, this course provides essential knowledge and skills valuable for nurses aiming to deliver high-quality, safe, patient-centered care. Quality improvement in nursing is not merely a theoretical concept but a practical approach that can be applied to various aspects of healthcare, and one critical aspect to remember is the importance of interdisciplinary collaboration. As frontline caregivers, nurses must collaborate with physicians, administrators, pharmacists, and other healthcare professionals to drive improvements in healthcare delivery.
As nurses continue to play a pivotal role in healthcare delivery, the knowledge and skills gained from this course will empower them to lead and actively participate in quality improvement initiatives. By applying quality improvement principles, nurses can contribute to better patient experiences, patient outcomes, and overall healthcare quality.
Final Reflection Questions
- What have you learned from this course?
- Why is interdisciplinary collaboration essential for nurses to effectively implement quality improvement initiatives in healthcare settings, and how can nurses foster collaboration among healthcare professionals?
- How does the concept of continuous learning and adaptation align with the dynamic nature of healthcare, and what strategies can nurses employ to stay current with evolving best practices and guidelines?
- In what ways does Quality Improvement benefit both healthcare providers and patients?
- What are the potential challenges in implementing QI initiatives in a healthcare organization?
- In what ways has QI in healthcare become intertwined with the broader goals of healthcare reform, such as improving patient outcomes and reducing healthcare costs?
- What role does leadership play in the effective implementation of QI models?
- How can leaders promote a culture of continuous improvement within healthcare organizations?
- How do QI models facilitate interdisciplinary collaboration among healthcare professionals to drive improvements in patient care?
- What challenges might healthcare organizations face when attempting to adopt and sustain QI models, and how can these challenges be overcome?
- How does the "testing and learning" concept in the PDSA cycle align with the principles of evidence-based practice in healthcare?
- In what ways do QI models promote patient-centered care and patient safety, and can you provide examples of tangible improvements in these areas achieved through QI initiatives?
- How can the Six Sigma model contribute to the reliability and consistency of healthcare processes?
- Safe: What steps can healthcare organizations take to minimize the risk of medical errors and adverse events?
- Practical: How do healthcare providers ensure that evidence-based treatments and interventions lead to positive patient outcomes?
- Patient-centered: Why is it important to involve patients in their care decisions, and how can healthcare professionals effectively engage patients in the decision-making process?
- Timely: What are some key factors contributing to delays in healthcare delivery, and how can these delays be reduced to improve timeliness?
- Efficient: How can healthcare processes and workflows be streamlined to enhance efficiency and reduce waste?
- Equitable: What are some barriers to achieving healthcare equity, and how can healthcare organizations address these disparities?
- How can nurses actively involve patients in data collection to enhance patient-centered care?
- What tools or technologies are available to streamline data collection processes in nursing practice?
- How can nurses effectively collaborate with interdisciplinary teams to gather comprehensive data for quality improvement initiatives?
- What strategies can nurses employ to maintain patient privacy and confidentiality while collecting sensitive healthcare data?
- What methods can nurse use to analyze and interpret the data they collect to identify areas for improvement?
- Why must nurses regularly review and assess the data they collect to drive continuous quality improvement in healthcare settings?
- Regarding patient falls, what strategies can healthcare organizations implement to reduce the incidence of patient falls, and how can nursing staff actively contribute to fall prevention efforts?
- How can nurses ensure the accurate and safe administration of medications, and what measures can be taken to minimize medication errors?
- What are the key nursing practices and interventions that can prevent the development of pressure ulcers in hospitalized patients, and how can nursing staff collaborate to achieve this goal?
- Why is patient satisfaction an important nursing quality indicator, and what actions can nurses take to enhance the overall patient experience?
- What impact do nurse-to-patient staffing ratios have on the quality of nursing care, and how can healthcare organizations ensure safe nurse staffing levels?
- How can nurses enhance patient education to promote better understanding and self-management of their health conditions?
- How can you ensure that the data collected is reliable and valid?
- What role does standardization play in data collection for quality improvement?
- How can you establish baseline data for comparison in your quality improvement project?
- What challenges or obstacles might you encounter when collecting data for quality improvement?
- How frequently should data be collected to monitor progress in a quality improvement project?
- How can you involve frontline staff in the data collection to ensure accuracy?
- What measures can be taken to protect patient privacy and confidentiality during data collection?
- How can you analyze the data collected to identify trends or patterns?
- What actions should be taken if the data collected indicates a problem or deviation from the desired outcome?
- What strategies can ensure that data collection remains an ongoing and sustainable practice in healthcare quality improvement efforts?
- What are the potential challenges or resistance nurses might encounter when implementing changes using these models?
- How can a guiding coalition or interdisciplinary team be effectively assembled to support nursing quality improvement efforts?
- What strategies can nurses employ to sustain changes and prevent reverting to previous practices once implemented?
- How can nursing leaders ensure that staff have the necessary knowledge and skills to embrace the changes outlined in these models?
- How can nurses use these change models to promote a culture of continuous improvement in healthcare settings?
- How can nurses ensure their implementation changes align with evidence-based best practices and clinical guidelines?
- What potential challenges or barriers might nurse teams encounter when trying to implement changes for quality improvement?
- What strategies can address resistance to change among nursing staff and promote their active participation in the implementation process?
- How can nursing leaders effectively communicate the expected outcomes and benefits of the change to gain support and commitment from their teams?
- What are the advantages of using data and performance metrics to monitor the progress and impact of change implementation in nursing practice?
- How can nursing staff ensure that changes are sustained and become integral to their daily practice rather than temporary modifications?
- Why is it crucial to consider the sustainability of change when evaluating its long-term impact on nursing quality improvement?
- What challenges or obstacles might nurse teams encounter when collecting and analyzing data for change evaluation, and how can these challenges be addressed?
- How can nursing leaders encourage a culture of continuous improvement among their teams as part of the change evaluation process?
- What strategies can be employed to ensure that the feedback and insights gathered during the evaluation phase are actively used to refine and optimize nursing practices?
- What are the potential consequences of not conducting thorough and systematic evaluations of changes in nursing practice for quality improvement?
- How can nursing staff and healthcare organizations ensure that the lessons learned from change evaluations are applied to future improvement initiatives to enhance patient care outcomes?
Workplace Violence Against Nurses
Introduction
The role of the registered nurse, while fundamentally dedicated to the care and wellbeing of patients, has long been fraught with challenges that extend beyond the complexities of medical care. One such pressing concern is workplace violence, an issue that nurses confront with alarming frequency. Recent statistics show that healthcare workers, particularly nurses, are at a higher risk for workplace violence compared to other professions.
Given the vital role nurses play in patient care and the broader healthcare system, it is imperative to understand the scope, sources, and solutions to this pressing issue. This continuing education course is dedicated to arming nurses with the knowledge, tools, and strategies to recognize, respond to, and prevent incidents of workplace violence, thereby ensuring their safety and the uninterrupted provision of quality care.
Workplace Violence
Definitions
The Occupational and Safety Health Administration (OSHA) (3) defines workplace violence (WPV for the purpose of this course) as any act or threat of physical violence, harassment, intimidation, or other threatening, disruptive behavior that occurs at the work site. This can also include verbal, written, or acts of sabotage against an individual while they are at work.
Workplace violence crosses all demographic barriers and is indiscriminate in who it can and does affect. Even seeing workplace violence influences morale, attendance, and the overall well-being of employees and their co-workers.
Types of Violence
Currently, there are four categories of workplace violence according to the American Nurses Association (5).
1: Criminal Intent - normally involves theft from the business or employees.
Example: Carol is working on documentation and notices a person lingering in the hallway. Carol doesn’t really think anything of it, assuming they are family members of one of the patients. Several minutes later, the person exits quickly from the supply room and down the stairs. Carol calls security to let them know, but they can’t locate the individual. After looking through the supply room, they find that several containers of wound dressing supplies are missing.
2: Customer/client/patient - the individual becomes violent with employees while receiving services.
Example: David was updating a family on their father’s critical condition. David could tell the family was upset, but the patient’s son seemed more frustrated than the others. During David’s explanation, the son grabbed David’s clipboard and yelled, “You’re not doing anything! You’re just letting him die!” The son then threw the clipboard at David’s head. David blocked the clipboard with his arm, receiving a rather deep cut as a result. Security became involved, and David had to go to the ER for treatment.
3: Worker on worker - an employee bullies, attacks, or threatens another employee.
Example: Emily was rounding when Dr. G. came onto the floor. This doctor was well known for being difficult to work with, and he always required the nurses to stand behind him in the room while he talked with his patients. Emily had one of Dr. G.’s patients today and was in the room, he asked her if the patient had ambulated. Emily told him they had not, but they planned to before and after lunch. The doctor made an audible sigh and while shaking his head at the patient said, “See…this is what I deal with every day. These nurses can’t get anything right. They’re all useless.”
4: Personal relationship - involves a person who has an interpersonal relationship with the nurse, but no association with the nurse’s employer or the business.
Example: Rebecca was walking to her car after work. Halfway to her car, she noticed an individual leaning against the trunk of her vehicle. Rebecca recognized this person as the someone her friend was currently dating. This person approached Rebecca aggressively and began yelling about gossiping and trying to break their relationship. Rebecca started back toward the building, hoping security was nearby, and was pursued by the female. Eventually, Rebecca made it to the building and got inside. Luckily, the door only opened with an employee badge, and Rebecca was safe. She went ahead to security.
Currently, the customer/client type of workplace violence is the most prominent, especially in healthcare and toward nurses. The American Nurses Association (ANA) reports that OSHA does not require employers to implement workplace violence prevention programs, but it supplies voluntary guidelines and may cite employers for not supplying a workplace free from recognized serious hazards.
Some states have legislated that employers develop a program while most states have advanced laws that amend existing statute for assaults of first responders by adding health care providers / nurses and/or increasing the penalty associated with such behavior. (3)
It is worth noting that since there are, in most cases, no actual requirements for employers to provide safe work environments for nurses, preventing and dealing with WPV proves problematic. It falls on nurses to understand what constitutes WPV, how to manage it, how to cope with it, how to report it, and how to ensure action is taken and a resolution is reached when WPV occurs.
Self Quiz
Ask yourself...
- In the scenarios above, should the employees report these incidents to administration at once?
- How would you describe the earlier scenarios on workplace violence?
- Why is it important to ask how you would find and describe workplace violence?
- Can you provide any examples of workplace violence you have experienced or seen?
Epidemiology
Workplace violence can take many forms, and the possible varieties and scenarios are endless. Regardless of how it manifests, the effects of workplace violence are clear and widespread. It can affect productivity of employees, morale, attendance, turnover rates, quality of work, patient outcomes, and much more.
Workplace violence can affect and involve workers, clients, customers, and visitors. WPV ranges from threats and verbal abuse to physical assaults and even homicide. In 2010, the Bureau of Labor Statistics (BLS) data reported healthcare and social aid workers were the victims of approximately 11,370 assaults by persons; a greater than 13% increase over the number of such assaults reported in 2009 (10). Almost 19% of these assaults occurred in nursing and residential care facilities alone. Unfortunately, many more incidents probably go unreported (5).

Impact on Nurses Well-Being
Workplace violence can take a heavy toll on nurses. These tolls can be emotional, mental, and physical as well as short-term or long-term. The seriousness of these injuries can vary widely ranging from minor upset to permanent injury and in worst cases, even death. (13)
This harm doesn’t stop with the nurse. The effects of workplace violence may also include effects spanning the unit the nurse works on or even the entire facility. Low morale, reduced productivity, lack of trust in employers, and fear of going to work can be results of violent events occurring to even a single co-worker.
Workplace violence can also have a financial effect on nurses and their employers related to lost time at work from injury or callouts, costs of care for treatment related to the incident (physical and/or psychological), or even legal fees. (13)
Given that incidents of workplace violence are rapidly increasing, these impacts are expected to increase as well. It is easy to see how this harm is widespread and can potentially ripple outward into the nurse’s professional and personal life. The stress and harm do not stay at work, and can spread to the nurse’s family, social interactions, and more.
Self Quiz
Ask yourself...
- How far reaching do you think workplace violence is?
- Can you give some examples of how workplace violence has affected you or your co-workers?
- What are some examples of how workplace violence against someone else can affect you or the patients on your unit?
Barriers to Reporting
One way to combat workplace violence is knowledge of its existence, its nature, and its frequency. Unfortunately, there are many factors that either prevent or discourage nurses from coming forward with reports when they are the victims of WPV.
A study presented in a Chinese nursing journal surveyed 325 nurses. Of these nurses, 266 were spread across 165 hospitals, and these hospitals were in 72 cities.
A total of 172 nurses (64.7%) experienced violent incidents during the past year. Of these incidents, 45.5% were reported; and the reporting rate of physical assaults (69.0%) was higher than those of verbal abuse (36.9%), threatening behavior (51.7%), and sexual harassment (60.0%). Formal reporting accounted for 25.4% (15.4% in written form and 10.0% through a computer-assisted reporting system.
Almost half of the nurses (49.6%) said that the hospital had no reporting system, or they were uncertain about the reporting system. For reasons of not reporting, 51.9% of the nurses were unaware of how and what types of violence to report, and 50.6% of the nurses believed that the hospital paid greater attention to patients rather than staff. (7)
Interestingly, almost fifty percent of the nurses surveyed had limited knowledge, if any, of a reporting system available to them, while fifty percent felt the hospital favored the patients over their own employees. Combined with an actual or perceived lack of supervisory support, this encourages an environment where nurses feel powerless to protect themselves or to take proper action when threatened or harmed.
The Minnesota Nurses Association, in August of 2022, published a press release with the results of a nursing survey on the topic of workplace violence. In this survey, ninety-seven percent of the nurses surveyed observed WPV or harassment over the previous two years.
The top reasons cited by nurses who did not report workplace violence were lack of time due to overwork and under-staffing, cited by fifty-eight percent of respondents, and lack of action by hospital management, cited by fifty-three percent of nurses in the survey. (4)
It would appear from these studies that many nurses feel it is futile to report incidents of workplace violence they encounter, and even if they realized an incident was reportable, they may not be aware of a way to report it or have time to do it. This perceived powerlessness and sense of futility in the face of abuse and violence will only continue to worsen unless action is taken to remove barriers to reporting and for nurses to have access to aid and support for supervisory staff.
Self Quiz
Ask yourself...
- Can you think of any examples of when you or a co-worker tried to report an incident of workplace violence and were unable to?
- If so, what was the barrier that prevented you from reporting?
- Can you name three alternative ways to report workplace violence at your organization?
Culture of Safety
A commonly used phrase is “Culture of Safety”, but is there a standardized definition of what it is or could be? Many resources point to the safety of patients about medical errors, patient rights, and protecting the patient’s information, but few address the issue facing caregivers and especially nurses. However, there is no agreed-upon or standard definition of what exactly a “culture of safety” is or what it should look like.
The American Nurses Association approaches the concept by saying, “Establishing a culture of safety in health care is essential to the security and well-being of your patients, staff, and organization. Effective nurse leaders embrace safety protocols that ensure their organization delivers a secure, protective environment that prioritizes patients and caregivers.” (12)
Currently, there is only a single federal legislation in place about the issue.
The only federal regulation currently in place is the General Duty Clause of the Occupational Safety and Health Act of 1970. This clause requires employers to supply a work environment free from recognized hazards that are causing or likely to cause death or serious physical harm. However, the general duty clause offers no specific recommendations about management of workplace violence.
The Occupational Safety and Health Administration (OSHA) issued guidelines for workplace violence prevention for health care and social service workers. First issued in 1996 and later updated, the guidelines are only advisory. (1)
It is paramount that nurses and other direct care providers accept the responsibility of creating policies and procedures within their organizations to define and enforce a work environment where violence is not tolerated and dealt with accordingly.
There is currently a small body of research and work of the effects workplace violence has on nurses as human beings. Most of the evidence focuses on how workplace violence increases the risk nurses present to patients in the form of medical errors, staffing issues due to missed work, poor documentation, etc.
The main body of evidence discussing how workplace violence affects nurses is noted in research around nurse burnout. A 2020 study published by the National Health Institute (10) states, “Workplace aggression is a source of extreme socio-emotional stress, which may lead to the experience of psychological strain.
A large body of research shows that exposure to workplace aggression and violence may severely impair healthcare workers’ mental health, including symptoms of post-traumatic stress disorder, depression, and burnout.”
This study also shows an important association with workplace aggression and violence targeting nurses and drastically increased levels of emotional exhaustion, depersonalization, and deep feelings of poor personal accomplishment. Over time, these feelings lead to complete burnout, and even worse, possibly psychological and/or physical conditions in the nurse affected.
Even with this preliminary information and research, we still have a long way to go to show the full and far-reaching effects of workplace violence on nurses. Again, by being proactive and acting now, we as nurses can foster this research and bring to light the issues so they can be addressed.
Self Quiz
Ask yourself...
- How does your organization define a “culture of safety”?
- Do you agree with the definition?
- How would you define a “culture of safety” from your own perspective given your experiences and challenges?
ANA Zero Tolerance Policy
In 2019 the American Nurses Association (ANA) (2) release a brief titled “Reporting Incidents of Workplace Violence”. In it, they discussed several issues surrounding workplace violence, barriers to its reporting, and made recommendations to healthcare organizations on strategies relating to the issues of workplace violence.
They also set forth a “Zero Tolerance Policy on Workplace Violence”, which provided some definitions and several recommendations on how to deal with WPV.
The introduction to the “Culture of Safety” part of this brief is as follows:
By prioritizing, developing, and sustaining an organizational culture focused on safety, we can drive the future of healthcare to a place where patients and those who care for them are free from harm. It is not only one of many priorities but is the overriding ethical imperatives for all leaders. (9)
The ANA also suggested a three-level prevention strategy, each with a part for the employer and the employee. Essentially, the role of the employer is gathering data, providing a “safe” work environment, non-punitive reporting, and development of programs to provide a safe work environment for nurses. The employee’s role is to take part in the implementation and evaluation of said programs.
Unfortunately, these are only suggestions and employers do not have to implement any programs or services to protect employees against workplace violence. Also, healthcare employers do not have to report any incidents to JCAHO who consider events of workplace violence to be “sentinel events”.
In the end, it falls on the nurses and employees directly affected by WPV to assume the charge against workplace violence, hold employers accountable, communicate with local and state legislators, and effect change to protect themselves.
Self Quiz
Ask yourself...
- Considering the recommendations and guidelines set forth by these entities, do you think they are adequate or effective? Why nor why not?
- How has this information changed your perception of the overall reporting process on workplace violence against nurses?
- What generalizations can you make from this information on the reporting process from an employer perspective?
Strategies to Prevent Workplace Violence
To end nurse abuse for good, Boston-Leary says it takes every nurse speaking up and reporting abuse within an organizational culture that has an established process for allowing nurses to report abuse without fear of recrimination and then follows up with a resolution. (8)
There are some suggested actions to help prevent and combat workplace violence in your practice setting. These actions include:
Know the definition of abuse.
The National Institute for Occupational Safety and Health (NIOSH) defines workplace violence as “the act or threat of violence, ranging from verbal abuse to physical assaults directed toward persons at work or on duty.”
Agreeing on this definition is an important first step to achieving widespread acknowledgement of the distinct types of nurse abuse, particularly non-physical abuse, Boston-Leary explains. (8)
Report Abuse
Ask about how your workplace manages abuse reporting, whether it is in your current workplace or when you are applying for a position, Boston-Leary suggests. “Ask about how reporting abuse happens during any shift because there should be a reporting mechanism in place for everyone, even if it’s on a weekend or evening shift with no manager easily accessible to report to.”
If (when) you do experience abuse, it’s essential that you speak up immediately and note any witnesses who could corroborate your description of the incident, she says.
Even after you experience abuse and even if you didn’t report it, it’s important to share your past abuse with others to empower them to report abuse they experience. (8)
Change Your Culture
Join or meet a committee to build or strengthen zero-tolerance abuse policies. Based on ANA’s Zero Tolerance Policy on Workplace Violence, Boston-Leary suggests these crucial elements of a zero-tolerance abuse program:
Stop violence before it starts through education to find risks and reduce vulnerabilities for workplace violence.
Create an effective response to violence immediately after it occurs, including emergency care.
Establish long-term responses that reduce the long-term negative effects of workplace abuse. (8)
Communicate with your Legislator!
Congress was considering legislation to #End Nurse Abuse by passing The Workplace Violence Prevention for Health Care and Social Service Workers Act (H.R 1195). If approved, this law would have required health care and social service industry employers to develop and implement a comprehensive workplace violence prevention plan that protects nurses and other healthcare professionals from on-the-job abuse.
Boston-Leary believes legislators are very attuned to the trusted voice of nurses to share about what is happening in health care today (8).
Self Quiz
Ask yourself...
- What is your organization’s primary method of reporting abuse or violence against employees?
- Do you know who your local and state legislators are and how to contact them?
- Are you aware of any committees or groups within your organization that actively address the issue of workplace violence?
Nurse-led Strategies
You can join these committees or work with your employer to create them. Collaborating with your supervisory staff and HR, you can create workflows, policies, reporting methods, and provide education on prevention of workplace violence and make a difference in your overall work environment.
Regarding Your Legislators
As mentioned before, 2021 Congress was considering federal legislation to end nurse abuse by passing The Workplace Violence Prevention for Health Care and Social Service Workers Act (H.R. 1195). The bill was passed by the House on April 16, 2021, but was never passed by the Senate.
You can find your local and state legislator contact information very easily on the internet. A simple search for “how to find state legislator contact information” is a wonderful place to start. As a voting citizen, you have every right to contact them, and demand laws be created to protect you while you work.
Below are some links to help you find elected officials:
- https://www.usa.gov/elected-officials
- https://www.usa.gov/state-governor
- https://www.senate.gov/senators/senators-contact.htm
- https://www.house.gov/representatives/find-your-representative
Advocate for your own safety the same way you would for your patients!
As nurses we aren’t afraid of stepping up to bat for our patients when they need something, but we are notorious for taking a hit and letting it slide, sometimes even to our own detriment.
We owe it to ourselves to offer that same level of advocacy to ourselves and our co-workers.

Self Quiz
Ask yourself...
- How can you become an advocate for yourself or your co-workers when it comes to workplace violence?
- Who is the contact in your organization for instances of workplace violence?
Resources
The Joint Commission supplies resources available to report and learn about how to report workplace violence. The links included are for federal, state, professional, and other resources. The direct link to this page is:
The Joint Commission: Workplace Violence Prevention Resources
Local law enforcement
As a private citizen, you are protected by laws about assault, battery, and other attacks on your person. You are within your rights to call the police on events of workplace violence, especially if your life or health are threatened, or you are physically attacked. It is likely your employer will not support you in this situation due to legal implications. It is best to ask your HR department and supervisory staff how these situations should be managed if they occur.
Legal Counsel
Consult with a lawyer about your legal rights in situations on workplace violence and how to best manage them. Be sure to bring scenarios, information on how your employer suggests dealing with these situations, and examples of violence you have seen or have experienced.
Educate and Train Yourself
Learn as much as you can about recognizing and managing workplace violence. Your employer may supply these courses, and if they don’t, it may be prudent to request them. Also, you can seek outside education and training on these topics including self-defense classes and crisis management courses.
Practice Self-Awareness
We all have inherent beliefs, perspectives, and feelings that can prevent us from acting in certain situations. Knowing yourself and understanding possible nuances within yourself that could be a detriment to you appropriately handling a situation of workplace violence could mean the difference between prevention and becoming a victim.
Self Quiz
Ask yourself...
- What training opportunities does your organization provide on management and follow-up for workplace violence?
- What information would you ask local law enforcement or a legal counsel for on workplace violence?
- What might someone who believes abuse against nurses is “just part of the job” do when they find themselves a victim of workplace violence?
- What can you do to help individuals that may simply allow workplace violence to affect their well-being?
Conclusion
Being an agent of change can be intimidating, terrifying, and even force us to deal with feelings and beliefs we didn’t even realize were in our way. Incidents of WPV have been rising sharply over the past several years, and there is no sign of slowing. It’s up to us as front-line workers, nurses, and co-workers to take responsibility for our own safety and work environment.
Through cooperation and consistency, we can create and bring solutions to the workplace and hopefully one day, aid in the creation of laws that make our jobs safer for us to supply the care and support our patients need. We owe it to ourselves to take the necessary steps to show our employers it’s time to address this issue. “Be the change you wish to see in the world.” ~Mahatma Gandhi –
Telemetry Basics – Rhythm Recognition
Introduction
To truly understand telemetry, nurses must have knowledge about the anatomy of the heart and how electricity passes through it, how the electrocardiograph (EKG) works to receive and record the electrical activity, and how this information is transmitted via telemetry to the appropriate receiving device.
Defined as the transmission of instrumental readings by various methods such as radio waves or wires, telemetry gathers and transmits EKG readings to a central or remote monitor for interpretation and storage (71). The ability to read EKG rhythms from a variety of monitors consists of more than looking at a rhythm strip and identifying the rhythm. It consists of knowing the anatomy of the heart, how electricity travels through it and translates into the EKG we know, and what changes can happen based on injury, electrolytes, or other causes.
Heart Anatomy 101
As we know, the heart consists of four chambers, two atria—right atria (RA) and left atria (LA)—and two ventricles—right ventricle (RV) and left ventricle (LV)—working in a cycle to ensure adequate blood flow occurs. The heart receives blood from the inferior and superior vena cava (IVC and SVC) and enters the RA, moves to the RV, passes through the pulmonary artery (PA) and lungs, returns to the LA, enters the LV, and exits the heart through the aorta.
Heart cells, known as myocytes, are negatively charged, or “polarized” at rest. When these muscle cells contract, they become “depolarized” or positively charged. But how do the myocytes know when to contract? Less than 1% of the cells in the heart have a special role and name. These are known as the pacemaker cells and their role is to ensure that the heart beats. This is done through the action potential that is spontaneously created by the pacemaker cells. Some of these pacemaker cells have different speeds in depolarization, meaning that the fastest pacemaker cells are the ones controlling the speed. This will make more sense later when discussing specific cardiac rhythms (69).
Starting in the right atria, the sinoatrial node (SA node) is the primary group of pacemaker cells that determines the heart rhythm. The SA node, as well as the other pacemaker cells within the heart, progress through a rapid depolarization and repolarization process (2).
Pacemaker cells do not have a true resting potential, this means they are always in an “unstable” state to create spontaneous action potential. The action potential is the brief reversal of polarity in the cell; polarity consists of potassium (K+) in the cell with a negative charge, while sodium (Na+) and calcium (Ca++) are outside of the cell with a positive charge (2).
Starting at the beginning of the cardiac cycle the pacemaker cells always have a membrane potential or voltage—the voltage of the cellular membrane as a result of permeability and concentrations of ions inside and outside the cell—of -60 microvolts (mV). From -60mV to -50mV the channels within the cells open, leading to a slow influx of Na+ inside the cell and a slow depolarization of the cell. Once the membrane voltage has reached the minimum threshold of -50mV the Ca++ channels open, causing Ca++ to move into the cell. This is known as the rising depolarization phase. The membrane voltage reaches the peak and the next thing that happens is the falling repolarization phase. This is where the K+ channels open to return the cell to a repolarized state (2).
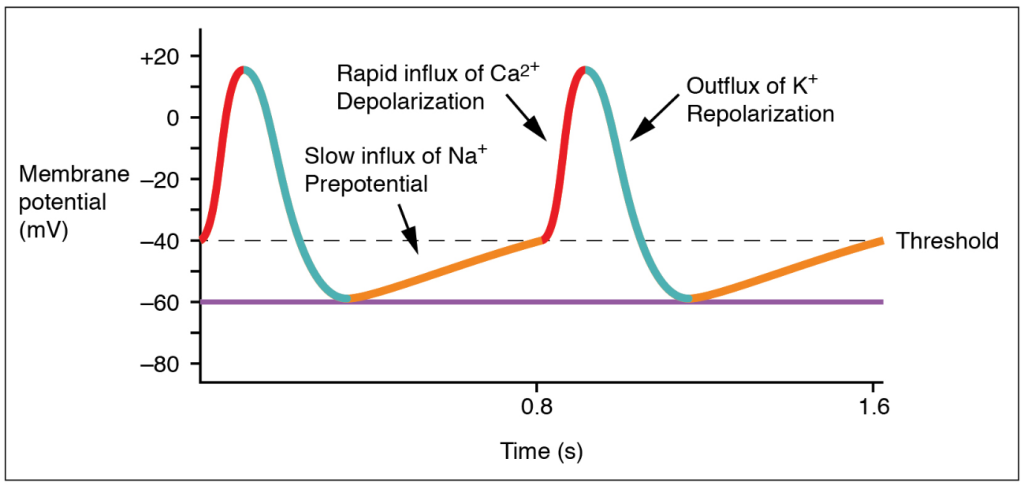
(20)
Once these steps have occurred, the energy is transferred to surrounding cells, and the cardiac cycle continues. However, the action potential in the other myocytes is slightly different. Myocytes have a resting potential, which is different from the pacemaker cells. The resting potential is around -90mV and these cells only start the depolarization process when stimulated by an external force. During the end of the pacemaker cell’s action potential phase, additional Ca++ is passed into the neighboring myocytes through gap junctions. The introduction of Ca++ into the cell causes a sharp rise in the membrane voltage that approaches the threshold which is -70mVs. Once that threshold has been reached, the NA+ fast channels open and a rapid depolarization occurs since Na+ is brought into the cell. The Ca++ slow channels open at -40mVs, further causing depolarization with Ca++ entering the cell (2).
At the peak of cellular depolarization, the Na+ channels close, leading to a slight repolarization through some K+ entering the cell. This is minor as the Ca++ channel is still open and continues to move K+ out of the cell. A plateau is created because of this and allows for the cell to go through two important phases. The first phase starts when the membrane voltage increases from the resting potential and continues until the plateau phase ends. This is known as the absolute refractory period and is where the myocytes relax before they can respond to additional stimuli. It prevents summation and tetanus which could lead to the heart not beating. The second phase is where additional Ca++ is pulled out of the sarcoplasmic reticulum (SR) to further push K+ out of the cell (2).
The phase ends when the Ca++ channel closes, extra Ca++ is sent back to the SR, and K+ is allowed back into the cell. The sodium/potassium pump allows Na+ to exit the cell, returning the cell to its resting potential. This rapid process occurs in every myocyte for the life of the cell. Pacemaker cells are the only cells that can generate a heartbeat. Impulses from the nervous system can increase or decrease the heart rate, but they are influencing the pacemaker cell to generate more beats, not creating them (2).
It is important to note that there are several sets of pacemaker cells within the heart. The SA node starts the process, but there are a few others spaced out along the electricity’s path to ensure that the atria and ventricles of the heart have time to fill and properly contract. The second set of pacemaker cells is the atrioventricular node (AV node) where a slight delay of 0.01-0.05 meters per second (m/s) happens to make sure that the ventricles fill up adequately. The bundle of His takes the electric impulse to the left and right bundle branches and from there, the Purkinje Fibers are triggered. These fibers have a speed of 2-4 m/s to provide enough force to eject the blood from the ventricles (69).
Correlating all of this back to telemetry, scientific development within the medical profession has allowed us to visualize this electrical activity and translate it into an effective method of diagnosing cardiac conditions such as abnormal heart rates or cell death.
Self Quiz
Ask yourself...
- Reflecting on what you know and what you have learned so far, what information would you consider important to know when it comes to reading EKGs or telemetry strips?
- What information, if any, was surprising to you in regard to the action potential of the pacemaker cells?
- Why do you think the pacemaker cells start with a voltage or an action potential?
Types of Telemetry
EKG
There are many ways to view cardiac rhythms now, however, the oldest method is the EKG. During the late 1700s, the Italian physician Luigi Galvani was experimenting with electricity and animal tissue. His experiments spanned at least three decades and inspired other physicians during and after his time. Using legs removed from the bodies of frogs, Galvani theorized that “animal electric fluid” enabled the muscles within the legs to move when touched by metals; according to him, this was “natural” fluid and not created as static electricity or friction is. He went on to theorize that the brain is an essential part of creating the “electric fluid” with nerves as the conductors (6).
Jumping forward to 1842, Doctor Carlo Matteucci made a significant contribution to EKGs. During his time researching electrical detection in animals, he discovered the electrical currents within the heart that accompany each heartbeat. Thirty-five years after Matteucci, Augustus Waller was able to use a capillary electrometer and electrodes to perform the first human EKG. These electrodes were placed on the chest and back of the participant and were vital in demonstrating there was electrical activity that preceded the contraction of the ventricles. William Bayliss and Edward Starling improved upon Waller’s research by using improved capillary electrometers to demonstrate triphasic cardiac electrical activity (1).
The Dutch physician most noted for creating the EKG known today was Doctor Willem Einthoven. He was inspired by Waller and those before him to improve the capillary electrometer, successfully identifying five deflections that were initially named ABCDE. Having to factor for inertia, Einthoven implemented mathematic correlation, resulting in the traditional EKG rhythm strips we use today with the letters PQRST depicted in the image below. Einthoven is also responsible for coining the word electrocardiogram or electrokardiogram in Dutch. This is where providers get the “k” in EKG from (1).
While Waller’s EKG utilized ten electrodes, Einthoven was able to condense that number to three, eliminating the right leg and the mouth electrodes. These three leads created Einthoven’s triangle; an important concept still used today and that will be discussed later. All of Einthoven's work resulted in him being awarded the Nobel Prize in Physiology and Medicine in 1924 (1).
Self Quiz
Ask yourself...
- What do you know of the history of the EKG and telemetry? Was there anything new you learned?
- What process of developing the EKG interested you the most? Why?
- Do you think there is more that can be done to improve EKG? If so, what do you think could be done?
Bedside Monitor
Emergency departments (ED), intensive care units (ICU), and other specialized areas that require continuous monitoring of a patient’s EKG and vital signs utilize various bedside monitors to ensure they are receiving accurate, real-time information on the patient. Cords are used to connect the patient to the monitor. The electrodes to display and document cardiac rhythm and heart rate are applied to patients in the standard 5 lead placement displayed in the below image. The vitals displayed on the monitor can also be displayed outside the room on a screen with multiple patients. Nurses, paramedics, or trained telemetry monitor technicians can watch many of these monitors at a time.
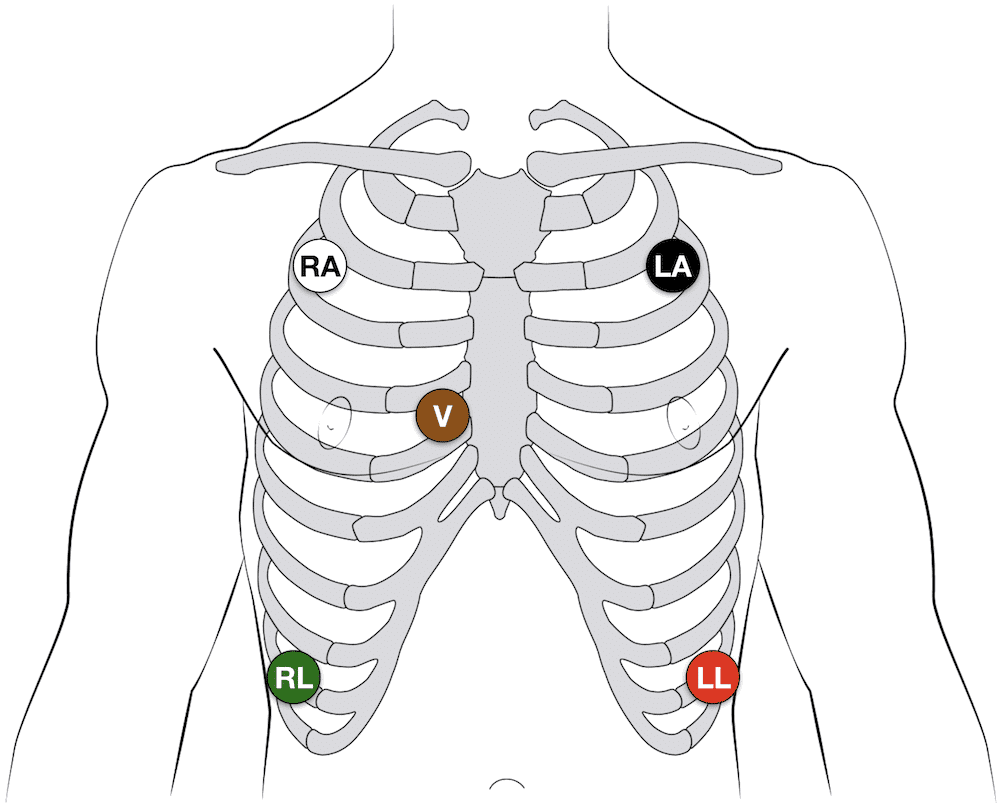
(14)
The placement of the five leads consists of the following:
- RA: 2nd intercostal space, anterior axillary on the right – some providers may put this lead higher on the chest or on the right arm
- LA: 2nd intercostal space, anterior axillary on the left – some providers may put this lead higher on the chest or on the left arm
- RL: 8th intercostal space, anterior axillary on the right – some providers may put this lead lower on the abdomen
- LL: 8th intercostal space, anterior axillary on the left – some providers may put this lead lower on the abdomen
- V: 4th intercostal space, right margin of the sternum
Note: Always follow the manufacturer’s instructions for specific lead placement.
Helpful Tip: Many healthcare providers quickly remember lead placement based on color is smoke (black) over fire (red) and snow (white) over grass (green). This leaves brown (chocolate) in the middle.
These bedside monitors can monitor pulse oximetry, respiratory rate, temperature, capnography, blood pressure, and arterial pressure. Some devices may have other unique monitoring features. These monitors may be portable or have a way to transfer the cords to a transport monitor. They come with alarms that can be adjusted based on the patient’s unique vital signs or hospital policy.
First responders have similar devices they use when transporting patients with the added benefit of having a defibrillator and a real-time feedback device built in (91).
Remote Monitoring
Remote cardiac monitoring is similar to bedside monitoring; however, the EKG rhythm, heart rate, and pulse oximetry are not displayed at the bedside. Instead, they are displayed in a different location, sometimes a monitor room, where a trained professional is watching many patients. When they recognize an abnormal rhythm, they will contact the appropriate staff to assess the patient. They may call for the leads to be removed, a change in rhythm, or a low battery.
The EKG leads are placed the same way as the bedside monitor leads are placed (always be sure to consult the manufacturer’s instructions). The information is transmitted wirelessly via wireless medical telemetry service (WMTS) from the “tele box,” but the leads must be wired to the box. WMTS does not use Wi-Fi and protects transmissions from Wi-Fi interference (48).
Mobile Cardiac Monitor and Event Monitor
A mobile cardiac or event monitor is a device attached to the skin that can perform continuous or event-specific monitoring. This device is attached to the patient’s chest near the heart and records when activated. This device is smaller than other portable cardiac monitoring devices like the Holter Monitor which will be discussed later. Information can be transmitted to the monitoring center to be reviewed by trained staff and/or artificial intelligence. Abnormalities like tachycardia, bradycardia, atrial fibrillation, or cardiac pauses are reported to a physician. The patient may or may not know about the rhythm abnormalities occurring as some patients are asymptomatic (18).
Event monitoring consists of the following methods (23):
- Patch monitor: depending on the manufacturer, the device is stuck to the chest and left on for a designated period of time.
- Loop memory monitor: the sensors always stay on the patient and the patient activates the devices to begin recording when symptoms occur in addition to a few minutes before the event starts and after it ends. There is an implanted option as well.
- Symptom event monitor: Patients place the monitor on them and activate it like a patch monitor, but only when symptoms start.
Insertable Monitor
Insertable or implantable cardiac monitors are just like mobile and event monitors, but they are surgically inserted into the patient. They perform the same actions, but there is an added benefit to these devices. If the patient has worn an external device in the past and has known cardiac arrhythmias, they may have an implanted cardioverter-defibrillator (ICD) inserted to detect and treat the abnormal rhythm. These devices are connected to the heart via wires (they may be placed in the right atria, the right ventricle, or both) and are operated by batteries that do need to be changed per manufacture direction. Patients and providers should be aware of magnets, or electrical signals from other devices that can interfere with the insertable device (61).
Healthcare providers can “interrogate” ICDs or pacemakers with a device created by the monitor’s manufacturer. When interrogated, the device’s information is transmitted to a monitor center who calls the provider to give them a verbal report of what the device has recorded; a paper copy is often faxed to the provider as well. Some newer interrogation devices may display the information of the device on the screen.
Holter Monitor
As mentioned with mobile cardiac monitors, the Holter monitor is another wearable device that can be used to monitor and diagnose cardiac arrhythmias outside of the hospital setting. This device consists of five electrodes and a monitor that the patient can wear or carry on them. It is similar to the remote telemetry devices used in the inpatient hospital setting as shown in the next image. Patients wear this device for a short time, and information is not transmitted to a monitor technician. Instead, information collected is sent to a monitoring center where it is interpreted and sent to the physician (58).
As covered in this section, there are many options for cardiac telemetry monitoring, and providers may encounter many types of them. It is important to know these devices and how they operate.
Self Quiz
Ask yourself...
- What types of telemetry/EKGs are you most familiar with? Which ones would you like to know more about?
- Are there any parts of the devices mentioned above that you have never heard of before?
- Out of all the devices which one do you like best? Which device do you not like?
- What devices do you think could be improved and how would you suggest improving them?
Lead Placement
Now that we have discussed the types of telemetry monitoring devices that are available, it is time to discuss how to properly place the EKG leads on a 12 lead, 15 lead, right-sided EKG, and where to place the V4R lead.
12 Lead EKG
For the 12 lead EKG, providers should start with the four limb leads (14):
- RA: On the upper or lower right arm
- LA: On the upper or lower left arm
- RL: on the upper or lower right leg
- LL: on the upper or lower left leg
From there, the six pericardial leads are placed strategically around the chest to create a partial circle around the heart (14):
- V1: 4th intercostal space, right margin of the sternum (this is lead V on the 5 lead EKG)
- V2: 4th intercostal space, left margin of the sternum
- V3: sits midway between leads V2 and V4 on the left
- V4: 5th intercostal space, mid-clavicular line on the left
- V5: 5th intercostal space, anterior axillary line on the left (aligned horizontally with V4, between V4 and V6) on the left
- V6: 5th intercostal space, mid-axillary line on the left (aligned horizontally with V4)
15 Lead EKG
The 15 lead EKG uses the same leads as the 12 lead EKG, but it adds V7, V8, and V9, known as the posterior leads, to encompass the posterior angles of the heart (14):
- V7: left posterior axillary line (aligned horizontally with V6, across from V5)
- V8: tip of the left scapula (aligned horizontally with V6, across from V4)
- V9: left of the spinal column (aligned horizontally with V6, across from V3)
Right Sided EKG
The right-sided EKG is important to rule out the diagnosis of a right-sided myocardial infarction (MI) or ischemia in or out while treating a patient. Lead placement is the same for the four limb leads, but the 6 precordial leads are flipped (14):
- V1: 4th intercostal space, left margin of the sternum
- V2: 4th intercostal space, right margin of the sternum (this is lead V on the 5 lead EKG)
- V3: sits midway between leads V2 and V4
- V4: 5th intercostal space, mid-clavicular line on the right
- V5: 5th intercostal space, anterior axillary line on the right (aligned horizontally with V4, between V4 and V6)
- V6: 5th intercostal space, mid-axillary line on the right (aligned horizontally with V4)
V4R Lead Placement
A full right-sided EKG is not always needed. Lead V4 on the right side of the heart is the most important lead when it comes to determining an MI on the right side of the heart (14):
- V1, V2, V3, V5, V6: same placement as the 12 and 15 lead EKGs.
- V4 is removed and placed on the right side of the chest
- V4R: 5th intercostal space, mid-clavicular line on the right (Where it is located on a complete right sided EKG)
- The “R” stands for right to ensure that those reading the EKG are aware that lead is on the right while the rest are located on the left side of the chest.
Limb Leads
Now that lead placement has been covered, we can now discuss how lead placement shows different parts of the heart.
Leads I, II, III, AVR, AVL, and AVF are considered limb leads when reading the EKG. It is important to note that the right leg lead is the grounding electrode and does not affect the EKG (83). Leads I, II, and III leads form a triangle over the chest known as Einthoven’s Triangle as reflected in the below image. Lead I always has negative polarity while lead III always has positive polarity. Lead II’s polarity depends on what side of the triangle is being discussed. If we are looking at lead I on the EKG, then lead II is positive, but if we are looking at lead III, then lead II is negative (82).
The importance of what leads are negative and positive comes from how electricity travels through the heart. It starts on the right side and moves to the left, so it would make sense for lead I to have negative polarity while leads II and III are positively charged (82). This is also why the height of a PQRST complex changes based on what lead is being looked at on an EKG as reflected below.
Augmented or unipolar leads AVR, AVL, and AVF have the heart as the negative electrode and the limb leads are the positive electrodes. AVR goes from the heart to the right arm lead, AVL goes from the heart to the left arm lead, and AVF goes from the heart to the left leg lead. Just as discussed with leads I, II, and III, the path of the electricity in the heart determines how the PQRST complex appears on the rhythm strip (82). Lead II is the preferred strip to read by providers due to the best view of the rhythm due to the way electricity travels through the heart and how lead II follows that path by starting at the right shoulder and going to the left leg.
The chest leads, V1 – V9, create a circle around the heart on a horizontal plane. These leads are unipolar as well, with the heart being the negative electrode. Multiple views of the heart are captured because of the many leads placed along the patient’s body. This can give providers valuable knowledge on what areas of the heart may be affected. The next image gives a visual depiction of how the leads display their view of the heart.
Self Quiz
Ask yourself...
- What lead do you think is the most beneficial in reading EKGs? Why do you think that?
- What lead do you prefer to use when reading EKGs? What makes that your “go-to” lead?
- If you could make a policy on EKGs, would you include what type of EKG should be done on patients? Would all patients with chest pain get a 15 lead EKG instead of 12?
- Do you think that one type of EKG is better than the other? Or do they all have their specific uses and benefits?
Reading EKGs: EKG Components
To be able to interpret EKGs successfully, nurses must first have knowledge about the EKG components displayed on the EKG strips and how each part correlates to a part of a single heartbeat.
P wave
The P wave is the first deflection from the isoelectric line or baseline. Correlating this to the heart, this is where the atria depolarize or contract. The contraction of the right atria starts at the beginning of the P wave while the contraction of the left atria begins in the middle and end of it. Normal P waves are apparent between 120 and 200 milliseconds (msec) before the upward deflection of the QRS complex (44)
PR Interval
The next part of the PQRST complex is the PR interval. The interval symbolized the time between the depolarization of the atria and the depolarization of the ventricle. The normal speed is 120 to 200 msec (44).
PR Segment
Next is the PR segment. This is similar to the PR interval but starts at the end of the P wave and ends at the start of the Q wave. This line is important because if there is a deviation from the isoelectric line, it could indicate a cardiac rhythm abnormality like Wolff-Parkinson-White syndrome which will be discussed later. The EKG may have a “slurred” upstroke from the P to R points on the EKG, making the Q wave appear to be on the isoelectric line. This is because the ventricles were stimulated or excited early, leading to a shortened PR interval. The “slurred” area is known as a delta wave (13).
QRS Complex
The QRS complex is where the ventricles depolarize and contract. The first downward deflection of the beat is the Q wave that lasts for < 0.05 seconds. It is present in all leads save for V1 and V3 due to the angle of the vector. The R wave is the upward deflection of the complex. R waves do not have a set height, but severely elevated R waves can be an indicator of ventricular hypertrophy. The second downward deflection is the S wave. Overall, the QRS complex is 0.07 to 0.10 seconds long and variations to this time can be an indicator of abnormal heart rhythms (17).
ST Segment
The ST segment starts when the S wave ends by returning to the isoelectric line and ends when the T wave begins. This period represented the completion of ventricular depolarization (17). The ST segment lasts 0.08 seconds to 0.12 seconds (51).
T Wave
The final wave in the standard EKG components is the T wave. This wave symbolizes the ventricles repolarizing. Inverted T waves can be an indication of past or current infections. A peaked T wave—as opposed to the normal curved T wave—can be caused by hypocalcemia, hyperkalemia, and left ventricular hypertrophy (17). The T wave runs from 0.01 seconds to 0.25 seconds (51).
The image below depicts the components of an EKG with labels to assist with understanding how the waves appear.
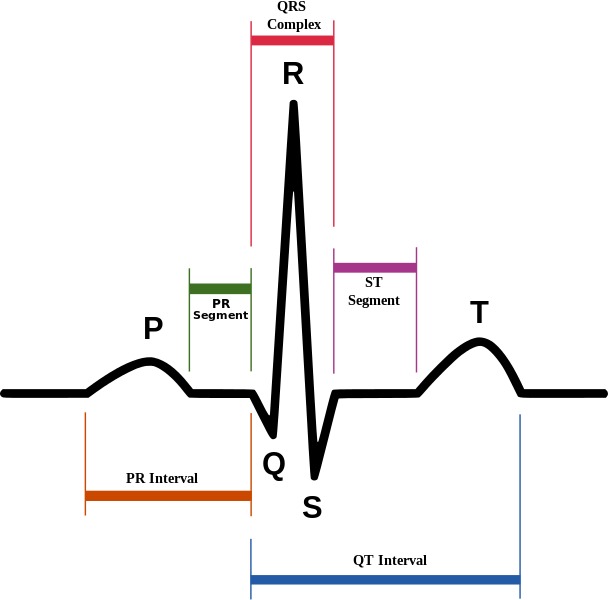
(4)
Reading EKGs: EKG Paper
The EKG paper has sets of squares, 25 little squares within one larger square. The smaller squares symbolize 0.04 seconds making the larger square 0.20 seconds. A single small square is 1mm while the large square is 5mm, this is because the larger square is five small squares tall.

(15)
Some EKG strips are presented in a six second format. To determine if the strip is a six-second, you must count the larger boxes. 30 larger boxes are required for the strip to be six seconds. Some may even have second markers that symbolize one second of time passed.
The 12 lead EKG can be more challenging to read and is often used to make an overall observation about the patient’s heart rate and rhythm. It can provide more information to providers than a single lead strip can.
As discussed previously, the leads are placed along the path of the heart, and providers can determine what part of the heart may be affected by knowing what leads are placed where.
| Lead | Location |
| II, III, AVF | Inferior |
| I, AVL, V5, V6 | Lateral |
| V2, V3, V4 | Anterior |
| V1, AVR | Right atrium, left ventricle |
(51)
Now that we have discussed leads, lead placement, the PQRST complex, and EKG paper, it is time to cover different cardiac rhythms that you may encounter.
Self Quiz
Ask yourself...
- What parts of the PQRST complex may not appear on the EKG strip?
- How do you remember what leads are associated with each part of the heart?
- What are some ways you can quickly determine heart rate using an EKG strip?
- Is there a part of the PQRST complex do you think is important to pay attention to? Why do you think that?
Rhythm Recognition
Normal Sinus (41):
- Rate: 60-100 beats per minute (bpm)
- Conduction:
- PR interval 120-200ms
- QRS width 60-100ms
- P wave morphology:
- The maximum height of the P wave is:
- Lead II and III: 2.5 mm
- The P wave is:
- Positive or above the isoelectric line in II and AVF
- Biphasic (curves above and then dips below the isoelectric line) in V1
- Duration:
- Less than 0.12 seconds
- Rhythm Strip:
- The maximum height of the P wave is:
(29)
Sinus Bradycardia (87):
- Rate: less than 60bpm
- Conduction:
- PR interval 120-200ms
- QRS width 60-100ms
- P wave morphology:
- The maximum height of the P wave is:
- Lead II and III: 2.5 mm
- The P wave is:
- Positive or above the isoelectric line in II and AVF
- Biphasic in V1
- Rhythm Strip:
- The maximum height of the P wave is:
(87)
- Signs and Symptoms:
- None – depending on the patient
- Cyanosis
- Peripheral edema
- Shortness of breath
- Dizziness
- Fatigue
- Syncope or near syncope
- Lightheadedness
- Causes (not limited to):
- Normal physiology in an athlete
- Medications like beta-blockers
- Ischemia
- Heart diseases
- Sick sinus syndrome
- Hypothermia
- Hypothyroidism
- Neuro-mediated bradycardia as caused by a vasovagal reaction
- Pericarditis
- Hypoxia
- Electrolyte imbalances
- Treatment:
- None if asymptomatic, admission for observation may be indicated
- Medications:
- Atropine 0.5mg every 3 to 5 minutes for a maximum dose of 3mg
- Antidotes or reversal agents
- Transcutaneous cardiac pacing or pacemaker
- Return patient to a normothermic state if hypothermic
Sinus Tachycardia (55):
- Rate: greater than 100bpm but less than 150bpm
- Conduction:
- PR interval 120-200ms
- QRS width 60-100ms
- P wave morphology:
- The maximum height of the P wave is:
- Lead II and III: 2.5 mm
- The P wave is:
- Positive or above the isoelectric line in II and AVF
- Biphasic in V1
- Rhythm Strip:
- The maximum height of the P wave is:
(42)
- Signs and Symptoms:
- Shortness of breath
- Chest pain
- Dizziness
- Syncope or near syncope
- Lightheadedness
- Palpitations
- Causes:
- Infection or sepsis
- Medications
- Withdrawal
- Electrolyte imbalances
- Blood loss or anemia
- Dehydration
- Hypoglycemia
- Pulmonary embolism
- Trauma
- Cardiac tamponade
- Myocarditis
- Pregnancy
- Treatment:
- Medications
- Antibiotics
- Antidotes or reversal agents
- Insulin
- Electrolyte replacement
- Fluids
- Heparin or other anticoagulant medications
- Blood replacement
- Surgery
- Medications
Self Quiz
Ask yourself...
- Looking at the signs and symptoms for sinus bradycardia what other signs and symptoms have you seen with patients who present with that heart rhythm?
- What other causes have you seen as the reason for sinus bradycardia?
- With sinus tachycardia, when would you be concerned with the causes of the rhythm?
- Are there any other treatments you could think of for either sinus bradycardia or tachycardia?
1st Degree AV Block (68):
- Rate: 60-100 beats per minute (bpm)
- Conduction:
- PR interval greater than 0.20 seconds
- P wave morphology:
- The maximum height of the P wave is:
- Lead II and III: 2.5 mm
- The P wave is:
- Positive or above the isoelectric line in II and AVF
- Biphasic in V1
- A QRS complex always follows the P wave
- The maximum height of the P wave is:
- Duration:
- Less than 0.12 seconds
- Rhythm Strip:
(32)
- Signs and Symptoms:
- None
- Fatigue
- Shortness of breath
- Syncope or near syncope
- Chest pain
- Lightheadedness
- Causes:
- Increased vagal tones in young patients
- Fibrotic changes in the elderly
- Cardiac disease
- Inflammation
- Medications
- Electrolyte abnormalities
- Treatment:
- None if asymptomatic
- Medications
- Antibiotics
- Antidotes or reversal agents
- Electrolyte replacement
2nd Degree Type I AV Block (Mobitz Type 1 or Wenckebach) (60):
- Rate: varies
- Conduction:
- PR interval increases with each beat, eventually “dropping off” and another P wave appears
- “Longer, longer, drop, that’s a Wenckebach.”
- P wave morphology:
- The maximum height of the P wave is:
- Lead II and III: 2.5 mm
- The P wave is:
- Positive or above the isoelectric line in II and AVF
- Biphasic in V1
- Rhythm Strip:
- The maximum height of the P wave is:

(27)
- Signs and Symptoms:
- None
- Fatigue
- Shortness of breath
- Syncope or near syncope
- Chest pain
- Lightheadedness
- Causes:
- Increased vagal tones
- Cardiomyopathy
- Myocardial infarction
- Cardiac surgery
- Electrolyte abnormalities
- Medications
- Treatment:
- None if asymptomatic
- Medications
- Atropine if bradycardic
- Antidotes or reversal agents
- Electrolyte replacement
2nd Degree Type II AV Block (Mobitz II) (60):
- Rate: varies
- Conduction:
- PR interval varies
- QRS width 60-100ms when present
- QRS does not follow all P waves
- P wave morphology:
- The maximum height of the P wave is:
- Lead II and III: 2.5 mm
- The P wave is:
- Positive or above the isoelectric line in II and AVF
- Biphasic in V1
- Rhythm Strip:
- The maximum height of the P wave is:
(40)
- Signs and Symptoms:
- Fatigue
- Shortness of breath
- Syncope or near syncope
- Chest pain
- Lightheadedness
- Cardiac arrest
- Causes:
- Structural heart disease
- Amyloidosis
- lymphoma
- Cardiac tumors
- Transcatheter placement of valves
- Myocardial infarction
- Genetics
- Treatment:
- None if asymptomatic
- Medications
- Atropine does not work on these patients
- Antidotes or reversal agents
- Transcutaneous cardiac pacing or pacemaker since this rhythm can progress to a complete heart block or cardiac arrest
3rd Degree AV Block (78):
- Rate: varies, but usually bradycardic
- Conduction:
- PR interval varies
- QRS width 60-100ms when present
- P wave and QRS complex do not communicate (called AV disassociation)
- P wave morphology:
- The maximum height of the P wave is:
- Lead II and III: 2.5 mm
- The P wave is:
- Positive or above the isoelectric line in II and AVF
- Biphasic in V1
- Rhythm Strip:
- The maximum height of the P wave is:

(33)
- Signs and Symptoms:
- Fatigue
- Shortness of breath
- Syncope or near syncope
- Chest pain
- Lightheadedness
- Hemodynamic instability
- Cardiac murmurs
- Cardiac arrest
- Causes:
- Cardiac surgery
- Cardiac disease
- Medications
- Electrolyte imbalances
- Lyme disease
- Transcatheter aortic valve replacement
- Myocardial infarction
- Systemic lupus erythematosus
- Sarcoidosis
- Treatment:
- Medications
- Atropine usually does not work, but can be administered
- Epinephrine
- Dopamine
- Antidotes or reversal agents
- Electrolyte replacement
- Transcutaneous cardiac pacing or pacemaker
- Medications
Self Quiz
Ask yourself...
- 2nd degree Type I and Type II can be mixed up, what are your methods for remembering how each one appears on the EKG strip?
- What type of AV block would lead you to provide quick intervention and why?
- Have you encountered a patient with any of these rhythms? What was the cause? How was it resolved, if it was?
- Are there any causes for these rhythms that were not listed?
Premature Ventricular Contraction (PVC) (88):
- Rate: varies, underlying rhythm is usually normal sinus
- The impulse to beat comes from the ventricles, not from the SA node
- Conduction:
- PR interval varies, but in a regular PQRST complex PR interval is 120-200ms
- PR interval after a PVC is longer due to the PVC and the retrograde concealed conduction goes back into the AV node junction.
- PVC QRS width is at least 120ms but usually 160-200ms
- Regular QRS width is 60-100ms
- PR interval after a PVC is longer due to the PVC and the retrograde concealed conduction goes back into the AV node junction.
- P wave morphology:
- The maximum height of the P wave is:
- Lead II and III: 2.5 mm
- The P wave is:
- Positive or above the isoelectric line in II and AVF
- Biphasic in V1
- Rhythm Strip:
- Monomorphic: All PVCs are shaped the same
- The maximum height of the P wave is:
(38)
- Biomorphic: PVCs are shaped differently
(64)
- Bigeminy: Every PVC is separated by one sinus beat.

(35)
- Trigeminy: Every PVC is separated by two sinus beats.
(9)
- Ventricular Couplet: Two PVC beats in a row.
(9)
- Ventricular Triplet: Three PVC beats in a row.

(9)
- Signs and Symptoms:
- None
- Fatigue
- Shortness of breath
- Syncope or near syncope
- Chest pain
- Palpitations
- Lightheadedness
- Abnormal neck pulsation
- Hemodynamic instability with frequent PVCs
- Cardiac arrest
- Causes:
- Hypoxia
- Illicit drug use
- Amphetamines
- Alcohol
- Cocaine
- Electrolyte imbalances
- Myocarditis
- Mitral valve prolapse
- Hypercarbia
- Cardiomyopathies
- Myocardial infarction
- Medications
- Treatment:
- None if asymptomatic
- Medications
- Beta-blockers
- Calcium channel blockers
- Amiodarone is for those with preexisting coronary artery diseases, but used with caution and close observation and monitoring
- Antidotes or reversal agents
- Electrolyte replacement
- Cardiac ablation
- Defibrillation if cardiac arrest occurs
Premature Atrial Contractions (PAC) (54):
- Rate: varies, underlying rhythm is usually normal sinus
- Conduction:
- PR interval varies, but in a regular PQRST complex PR interval is 120-200ms
- PAC
- Regular QRS width is 60-100ms
- P wave morphology:
- The maximum height of the P wave is:
- Lead II and III: 2.5 mm
- The P wave:
- Can be inverted
- May be hidden in the T wave creating a hump or peaked T wave
- These rhythms can come in the same variations as PVCs:
- Bigeminy
- Trigeminy
- Couplet
- Triplet
- Rhythm Strip:
- The maximum height of the P wave is:
(37)
- Signs and Symptoms:
- None
- Palpitations
- Shortness of breath
- Anxiety
- Signs and symptoms of heart failure
- Early or additional heart sounds
- Pauses in rhythm
- Causes:
- Coronary artery disease
- Left ventricular hypertrophy
- Septal defects
- Congenital heart deformities
- Medications
- Beta-blockers
- Chemotherapeutic agents
- Congestive heart failure
- Diabetes mellitus
- Hypertension
- Chronic obstructive pulmonary disorder
- Anxiety
- Treatment:
- None if asymptomatic
- Avoiding triggers
- Medications
- Beta-adrenergic blockers
- Antiarrhythmic agents are used with caution and close observation and monitoring
- Antidotes or reversal agents
- Cardiac ablation
Self Quiz
Ask yourself...
- Between PACs and PVCs, which one would you be more concerned about? Why did you pick that rhythm?
- Have you encountered a patient with either of these rhythms? What treatments were ordered if any?
Ventricular Tachycardia (V Tach) (45):
- Rate: greater than 100bpm
- Conduction:
- PR interval none
- QRS width greater than 140ms
- P wave morphology:
- Not present
- Non-sustained V-Tach: three or more ventricular beats over a maximum of 30 seconds.
- Sustained V-Tach: a run of V Tach for more than 30 seconds or less is treated by cardioversion
- Monomorphic V-Tach: all ventricular beats look the same
- Polymorphic V-Tach: the ventricular beats look different.
- Biphasic V Teach: where the QRS complexes alternate with each beat.
- Digoxin intoxication
- Long QT syndrome
- Rhythm Strip:
- Monomorphic V-Tach
(11)
- Signs and Symptoms:
- Palpitations
- Shortness of breath
- Chest pain
- Syncope or near syncope
- Signs of heart failure
- Hemodynamic instability
- ICD shocks if the patient has one
- Cardiac arrest
- Also known as pulseless V-Tach
- Causes:
- Ischemic heart disease
- Acute coronary artery disease
- Myocardial scar-related reentry
- Congenital heart deformities
- Cardiomyopathy
- Illicit drugs
- Cocaine
- Digitalis toxicity
- Methamphetamine
- Medications
- Beta-blockers
- Chemotherapeutic agents
- Electrolyte imbalances
- Sepsis
- Metabolic acidosis
- Inherited cardiac channelopathies
- Treatment:
- Cardiopulmonary resuscitation (CPR) and defibrillation if no pulse present
- Cardioversion if hemodynamically unstable and has a pulse
- Treatment for myocardial infarction
- Medications
- Amiodarone, procainamide, sotalol
- Antidotes or reversal agents
- ICD
- Cardiac ablation
Self Quiz
Ask yourself...
- What would be the priorities when providing care to a patient with V-Tach with a pulse?
- If you were the only one in the room with the patient what would be your first action?
- Have you ever cardioverted a patient with this rhythm? What do you remember from the event?
- Do you think the patient should sign consent before cardioversion? Why or why not?
Torsades de Pointes (V Fib) (25):
- Rate: none
- Conduction:
- Polymorphic V-Tach with a prolonged QR interval
- P wave morphology:
- Not present
- Rhythm Strip:
(12)
- Signs and Symptoms:
- None
- Syncope or near syncope
- Dizziness
- Lightheadedness
- Hypotension
- Rapid pulse
- Cardiac arrest
- No pulse
- Not breathing or only gasping for air
- Loss of consciousness
- Causes:
- Electrolyte imbalances
- Medications
- Zofran causes a long QT interval (19)
- Congenital prolonged QT:
- Jervell and Lange-Nielsen
- Romano-Ward syndrome
- Bradycardia
- Diuretic use
- Female gender
- Age
- Treatment:
- Electrolyte replacement
- CPR and defibrillation
- Medications
- Epinephrine
- Atropine
- Cardioversion
- Treatment of the underlying cause
Supraventricular Tachycardia (SVT) (72):
- Rate: Greater than 160bpm
- Conduction:
- PR interval not present
- QRS width less than 120 milliseconds = narrow complex, regular SVT
- QRS width greater than 120 milliseconds = wide complex, regular SVT
- P wave morphology:
- Not present
- Rhythm Strip:
- Narrow complex, regular SVT
(30)
- Wide complex, regular SVT

(79)
- Signs and Symptoms:
- None
- Hypotension
- Shortness of breath
- Lightheadedness
- Signs and symptoms of heart failure
- Shock
- Causes:
- Narrow complex, regular SVT - Orthodromic reentry phenomenon (56):
- Accessory pathway that connects the atria and ventricles without passing through the AV node
- A pulse goes through the AV node, down into the ventricles via the Bundle of His, up through the accessory pathway, and back into the AV node
- Wide complex, regular SVT - Atrioventricular reentry phenomenon (57):
- Signals from the SA node travel through the accessory pathway down the ventricles via the Bundle of His and up to the AV node, creating a backward cycle.
- This is slower than the orthodromic SVT because it is traveling against the regular path of conduction, leaving to a wide QRS complex
- Medications
- Caffeine
- Smoking
- Stress
- Alcohol
- Narrow complex, regular SVT - Orthodromic reentry phenomenon (56):
- Treatment:
- None if asymptomatic
- Vagal maneuvers
- Bearing down
- Blowing into a straw
- Medications
- Adenosine: 1st dose 6mg, 2nd dose 12mg
- Ensure rapid saline flush after pushing medication as it has an extremely short half-life
- Cardizem
- Antidotes or reversal agents
- Adenosine: 1st dose 6mg, 2nd dose 12mg
- Cardioversion
- Cardiac ablation
Self Quiz
Ask yourself...
- If you have encountered a patient in SVT, what vagal maneuvers have you seen used? Were they successful or not?
- If you have not encountered a patient with SVT, what vagal maneuvers could you think of that might be utilized?
- Would a patient’s age impact the vagal maneuvers used? Why or why not?
- Do you know the half-life of Adenosine? If not, will you look it up after this course?
Ventricular Fibrillation (V-Fib) (3):
- Rate: none
- Conduction:
- PR interval not present
- QRS width not present
- P wave morphology:
- Not present
- Rhythm Strip:
(39)
- Signs and Symptoms:
- Cardiac arrest
- No pulse
- Not breathing or only gasping for air
- Loss of consciousness
- Causes:
- Electrolyte imbalances
- Myocardial infarction
- Congenital heart defects
- Sudden blow to the chest right over the heart
- Medications
- Anemia
- Cardiomyopathy
- Electrocution
- Thoracic trauma
- Heart surgery
- Treatment:
- CPR and defibrillation
- Medications
- Epinephrine
- Atropine
- Electrolytes
- Surgery
- Coronary perfusion
- Treatment of the underlying cause
- Cardiac arrest
Asystole (59):
- Rate: none
- Conduction:
- PR interval not present
- QRS width not present
- P wave morphology:
- May or may not be present
- Rhythm Strip:

(21)
- Signs and Symptoms:
- Cardiac arrest
- No pulse
- Not breathing or only gasping for air
- Loss of consciousness
- Causes:
- Electrolyte imbalances
- Myocardial infarction
- Congenital heart defects
- Medications or illicit drugs
- Blood loss
- Cardiomyopathy
- Electrocution
- Trauma
- Treatment:
- CPR
- Since there is no electrical activity with this rhythm, defibrillation cannot be used
- Medications
- Epinephrine
- Atropine
- Electrolytes
- Surgery
- Coronary perfusion
- Treatment of the underlying cause
- CPR
- Cardiac arrest
Pulseless Electrical Activity (PEA) (22):
- Rate: varies
- There is no pulse with this rhythm despite the fact that it may appear as an organized rhythm
- Conduction:
- PR interval none
- QRS width greater than 110ms
- P wave morphology:
- Not present
- The P wave is:
- Not present
- Rhythm Strip:
(22)
- Signs and Symptoms:
- Cardiac arrest
- No pulse
- Not breathing or only gasping for air
- Loss of consciousness
- Causes:
- Electrolyte imbalances
- Myocardial infarction
- Congenital heart defects
- Medications or illicit drugs
- Blood loss
- Cardiomyopathy
- Electrocution
- Trauma
- Hypothermia
- Pneumothorax or hemothorax
- Treatment:
- CPR
- Since there is no electrical activity with this rhythm, defibrillation cannot be used
- Medications
- Epinephrine
- Atropine
- Electrolytes
- Surgery
- Coronary perfusion
- Treatment of the underlying cause
- CPR
- Cardiac arrest
Self Quiz
Ask yourself...
- What are some misconceptions about V-Fib, asystole, and PEA?
- How do you educate other staff members and family members on these misconceptions?
- What treatments have you seen work on V Fib? What treatments did not work?
- Have you ever seen a patient’s rhythm change from asystole to another rhythm?
- What is the most prominent cause of cardiac arrest in your area?
Atrial Flutter (73):
- Rate: varies
- Depends on how many QRS complexes there are
- Atrial rate 250-350 bpm
- Ventricular rate 75-150bpm
- P waves can come in blocks
- 2 P waves per 1 QRS (2:1)
- 3 P waves per 1 QRS (3:1)
- 4 P waves per 1 QRS (4:1)
- Intervals of P waves per 1 QRS (2:1 then 3: 1 then 2:1 then 4:1)
- Conduction:
- PR interval varies
- QRS width 60-100ms
- P wave morphology:
- The maximum height of the P wave is:
- Lead II and III: 2.5 mm
- Sawtooth pattern
- Rhythm Strip:
- The maximum height of the P wave is:
- Depends on how many QRS complexes there are
(31)
- Signs and Symptoms:
- None
- Palpitations
- Fatigue
- Syncope or near syncope
- Shortness of breath
- Regular or irregularly regular pulse
- Causes:
- COPD
- Heart failure
- Atrial size abnormalities
- Hypertension
- Diabetes mellitus
- Age
- Male gender
- Treatment:
- None if asymptomatic
- Medications
- Amiodarone
- Cardizem
- Metoprolol
- Anticoagulation to prevent stroke
- Catheter ablation
- Treatment of the underlying cause
Atrial Fibrillation (AFib) (89):
- Rate: varies
- Atrial rate 400-600 bpm
- Ventricular rate 75-175 bpm
- Anything over 100 is considered A Fib with rapid ventricular response (RVR)
- Conduction:
- PR interval varies
- QRS width 60-100ms
- P wave morphology:
- The maximum height of the P wave is:
- Lead II and III: 2.5 mm
- Rhythm Strip:
- A Fib
- The maximum height of the P wave is:
(28)
- A Fib RVR

(34)
- Signs and Symptoms:
- None
- Palpitations
- Fatigue
- Syncope or near syncope
- Shortness of breath
- Regular or irregular pulse
- Patients can go in and out of A Fib or it can be permanent,
- They can go in and out of RVR
- Causes:
- Heart disease
- Genetics
- Pulmonary embolism or other hemodynamic stressors
- Obstructive sleep apnea
- Heart failure
- Pericarditis
- Myocarditis
- Myocardial infarction
- Hypertension
- Diabetes mellitus
- Age
- Treatment:
- None if asymptomatic
- Medications
- Cardizem
- Metoprolol
- Amiodarone
- Anticoagulation to prevent stroke
- Catheter ablation
- Treatment of the underlying cause
Idioventricular Rhythms (47):
- Rate: varies
- Idioventricular rate 35-40bpm
- Accelerated rate 60-120bpm
- Conduction:
- PR interval not present
- QRS width greater than 120ms but can be greater than 160ms
- The normal conduction system does not transmit the signal to beat, the vertical signal is transmitted from cell to cell
- P wave morphology:
- Not present
- Rhythm Strip:
- Idioventricular rate

(36)
- Signs and Symptoms:
- None
- Palpitations
- Fatigue
- Lightheadedness
- Syncope or near syncope
- Cardiac arrest
- Causes:
- Electrolyte imbalances
- Reperfusion of cardiac cells after a myocardial infarction
- Medications
- Digoxin
- Beta-adrenoreceptor agonists
- Illicit drug use like cocaine
- Cardiomyopathies
- Congenital cardiac defects
- Athletes
- Treatment:
- None if asymptomatic
- Medications
- Atropine
- Amiodarone or lidocaine
- Reversal agents
- Rarely cardiac pacing
- Treatment of the underlying cause
Junctional Rhythms (52):
- Rate: varies
- Junctional bradycardia less than 40bpm
- Junctional escape rhythm 40-60bpm
- Accelerated junctional rhythm 60-100bpm
- Junctional tachycardia greater than 100bpm
- Conduction:
- PR interval not present
- QRS width 60-100ms
- P wave morphology:
- Not present
- Rhythm Strip:
- Accelerated Junctional Rhythm
- Rhythms look the same but have more beats depending on the type of rhythm
- Accelerated Junctional Rhythm

(52)
- Signs and Symptoms:
- None
- Shortness of breath
- Palpitations, intermittent or continuous
- Fatigue
- Lightheadedness
- Syncope or near syncope
- Causes:
- Electrolyte imbalances
- Can be caused by anorexia nervosa
- Thoracic trauma
- Myocarditis
- Reperfusion of cardiac cells after a myocardial infarction
- Medications
- Adenosine
- Clonidine
- Antiarrhythmics
- Lithium
- Digoxin
- Sleep apnea
- Hypoxia
- Coronary artery disease
- Congenital cardiac defects and repairs of these defects
- Electrolyte imbalances
- Treatment:
- None if asymptomatic
- Medications
- Atropine
- Reversal agents
- Transcutaneous pacing
- Permanent pacemaker
- Treatment of the underlying cause
Bundle Branch Blocks (BBB) (43, 53, 70):
- Rate: varies
- Conduction:
- Right BBB (RBBB):
- QRS interval greater than 120ms
- Septal depolarization that leads to a:
- Small R wave being present in V1
- Q wave in V6
- The left ventricle’s contraction leads to and:
-
- S wave in V1
- R wave in V6
-
- The right ventricle’s contraction leads to an:
- R wave in V1
- Deep S wave in V6
- Left BBB (LBBB):
- QRS interval greater than 120ms
- T wave inversion is due to abnormal repolarization
- From first principles:
- Septal depolarization that leads to a:
- Q wave in V1
- R wave in V6
- Right BBB (RBBB):
-
-
- The right ventricle’s contraction leads to an:
- R wave in V1
- S wave in V6
- The left ventricle’s contraction leads to and:
- S wave in V1
- R wave in V6
- The right ventricle’s contraction leads to an:
- P wave morphology:
- The maximum height of the P wave is:
- Lead II and III: 2.5 mm
- Rhythm Strip:
- RBBB
- The maximum height of the P wave is:
-
(71)
-
-
-
- LBBB
-
-
(71)
- Signs and Symptoms:
- None
- Lightheadedness
- Syncope or near syncope
- Causes:
- RBBB:
- Myocardial infarction
- Congenital cardiac defects
- Pulmonary embolism
- Myocarditis
- Pulmonary hypertension
- LBBB:
- Myocardial infarction
- Hypertension
- Cardiomyopathy
- Myocarditis
- Treatment:
- None if asymptomatic
- Treatment of the underlying cause
- RBBB:
Identifying Ischemia and Infarction
Known as coronary artery disease (CAD), acute myocardial ischemia is the decrease of blood flow to the heart by atherosclerosis or plaque. The atherosclerosis starts as a plaque streak within the large arteries and continues to build up. After the plaque has grown to a significant size, occlusion begins and blood flow to areas below the growing occlusion suffers a decrease in blood flow. This is what is known as ischemia (81).
When resting, patients may not experience any signs or symptoms. Upon exertion, however, patients may experience stable angina—chest pain, discomfort, pressure, etc.—as activity requires increased blood flow and the arteries constrict to pump blood through the body faster. This pain is relieved at rest and can be further treated by nitrates. The routine is what makes this stable angina (81).
Unstable angina begins once the artery has become occluded enough to create a significant obstruction of blood flow. Signs and symptoms can include chest pain or other discomfort that is challenging to relieve, even when at rest. Patients may be woken from sleep due to the pain and report that it takes longer for the pain to decrease or resolve completely. These signs and symptoms symbolize that the plaque within the artery is unstable and could potentially rupture (90).
Infarction is when the blood flow is completely obstructed and the cells below the obstruction begin to die off. This often occurs when the plaque within the artery ruptures, leading to the body’s natural clotting processing in an attempt to repair the rupture, and a complete occlusion of the artery occurs (46).
Now that we have discussed ischemia and infarction, it is time to discuss how a myocardial infarction (MI) appears on an EKG and how to identify it. You may also hear them referred to as STEMIs or ST-elevation myocardial infarction.
The progression of PQRST complex changes during an MI can start with hyperacute T waves. The T wave will increase with amplitude and become wider, while some ST elevation may be noted. This elevation begins to occur as injury to the heart muscle begins. From there, the ST elevation increases and creates the image often associated with an MI. Pathological Q wave may develop as the MI progresses. As discussed earlier, the Q wave is the first downward deflection of the QRS complex and is normally 1mm or less in depth. Pathological Q waves are measured by greater than 1mm wide or greater than 25% of the R wave’s amplitude (84).
T wave inversion occurs when the cells have become necrotized and begin to form fibrosis. Once all necrotized cells have become fibrotic, the Q waves will remain, but the T waves will become upright again (84).
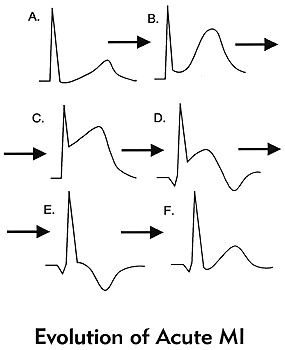
(84)
These changes should be present in at least 2 contiguous leads or leads that are side by side. To discuss this more, we will refer to the 12 lead EKG photo we used earlier. It is important to know that there will be leads with ST elevation and there will be leads with reciprocal ST depression based on the type of MI and how these leads are placed in relation to the area of the heart that is being affected.
| Type of MI | Leads with ST Elevation | Reciprocal ST Depression |
| Inferior | I, II, AVF | I, AVL |
| Lateral | V5, V6 | III, AVR |
| Anterior | I, AVL, V5, V6 | II, III, AVF |
| Posterior | V7, V8, V9 | V1, V2, V3 |
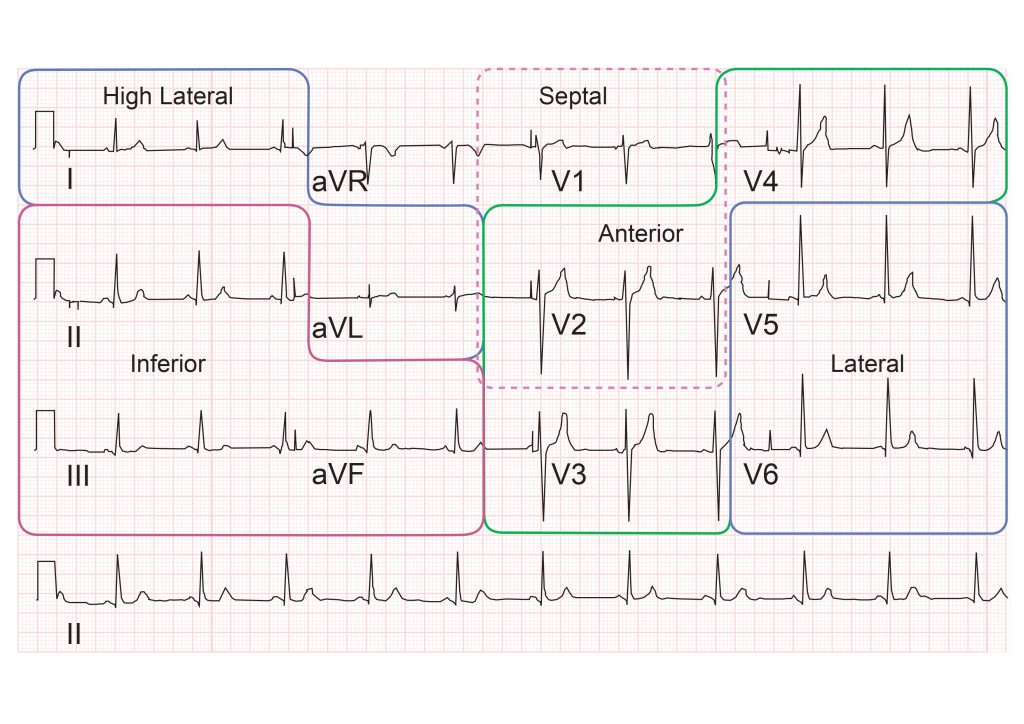
(82)
With posterior MIs the elevation must be at least 0.5mm, there will be tall, broad R waves of at least 30ms long, and the T wave will be upright. When looking at an EKG for a posterior MI, the ST depression is what will be observed in leads V1, V2, and V3. If a posterior MI is suspected, look at the EKG from the back of the paper by flipping it over and holding it to light. This will display the ST depression as ST elevation, prompting you to consider a posterior EKG. It is advised that a posterior EKG with leads V7, V8, and V9 be done. A quick method to do this is by removing leads V4, V5, and V6; placing them in the posterior lead positions; and relabeling them on the EKG. (77).
Right ventricular MIs can occur, and it is important to assess and treat them appropriately. To assess for a right-sided MI, first look at the standard EKG. If ST elevation is noted in leads II and III, but the ST elevation is greater in lead III than lead II, consider right ventricular involvement. As discussed previously, one method is to do a right-sided EKG, with lead placement along the right side of the chest. The second, quicker way to do this is to take lead V4 and place it on the right side of the chest and mark it as V4R on the EKG (77).
Another rhythm that can be an indicator of an MI is a bundle branch block. New or suspected new BBBs are to be treated as a MI by providers. But what if you have a copy of an old EKG and the BBB isn’t new, can the patient still be having an MI? The answer is yes. However, it can be challenging to determine what is a change from the MI and what is from the BBB. The Sgarbossa criteria is useful in making these determinations and can also be used for patients who have a pacemaker (77)
Sgarbossa criteria (77):
- Concordant ST elevation that is greater than 1mm
- Concordant ST depression that is greater than 1mm
- Excess discordant ST elevation that is greater than 5mm in leads with negative QRS complexes – these are complexes below the isoelectric line
For reference, concordance means that the ST segment and QRS complex go in the same direction, either both deflecting upwards or downwards. Discordance is what should be seen in a BBB or paced rhythm. This is where the ST segment and the QRS complex go in different directions. Smith et al. created a modification to the Sgarbossa criteria to include a greater than 1mm ST elevation to an S-wave amplitude ratio of greater than 0.25mm (7).
Another method that has been created, but not validated is the Barcelona criteria. This criterion has greater than 1mm ST deviation concordance or discordance with QRS polarity in any EKG lead. Discordant ST deviation is greater than 1mm in any lead where the R or S points of the QRS complex are less than 6mm (7).
There is an EKG rhythm that can indicate a future MI which is known as Wellens syndrome. This EKG has a deeply inverted or biphasic T wave in leads V2 and V3. The patient is often pain-free when the rhythm is present, ischemic chest pain can obscure the rhythm by creating a false normal appearance of the T waves in the affected leads. Their cardiac enzymes may not even be elevated. Any patient presenting with chest pain should have serial EKGs done for this reason, since they may be pain-free at a later time. These EKG changes symbolize the critical stenosis of the proximal left anterior descending artery (LAD). This is the artery that provides the left ventricle with blood (65).
Self Quiz
Ask yourself...
- Do you remember the first patient that you had that was experiencing an MI? What stood out about that patient in your mind?
- Patients have a variety of symptoms that can be experienced during an MI, what was the most interesting symptom a patient had during an MI?
- Have you ever encountered a patient with Wellens Syndrome? Do you know if they ended up having an MI later?
Cardiac Assessment:
A traditional cardiac assessment focuses on more than just the heart; it encompasses aspects of both the neurological and respiratory systems. However, we will begin our focus with the heart.
Pain may not be a word patients use to describe what they are feeling. As mentioned, they may vocalize discomfort, pressure, cramping, burning, or tightness. Women may have jaw or arm pain as opposed to the traditional chest pain that men may experience. Ask them to rate their pain on a scale of one to ten, looking for changes in the value. An EKG based on pain, discomfort, pressure, cramping, or tightness should be completed within the time frame set by hospital policy.
The PQRST pneumonic can assist providers in remembering the specific information they need to collect (90).
P: What provokes, precipitates, or palliates/alleviates the pain or discomfort the patient is feeling? Does it get worse or better when you do certain things, i.e., walk or rest?
Q: What is the quality of pain or discomfort you are feeling?
R: Does this pain or discomfort radiate anywhere else in your body? Jaw, arm, back?
S: Are there associated symptoms with the pain or discomfort? Shortness of breath, dizziness, heartburn?
T: What time elements are involved? When did it start? Did it stop and come back? Are you currently feeling it now? Was it gradual or did it occur suddenly? Did it wake you up?
Patients should be asked about palpitations or any experienced abnormal heart rhythms detected on monitoring devices. Many individuals have smartwatches that can detect heart rates and some rhythms. If the patient is wearing one, determine if the device has recorded anything.
Edema in the legs can be a sign of acute heart failure while pain in the calf can indicate a blood clot that could have traveled from another part of the body (85). In A Fib, the blood can clot in the ventricles due to poor circulation of blood. It will pool until it clots or is ejected from the heart. Once expelled, the clot will travel until it can no longer pass through the veins (63). Ensure a thorough assessment of the patient’s distal pulses is done as well to determine circulation. The further pulse locations can be an indicator of poor circulation (85).
Moving on to the respiratory system, we will reflect on the many arrhythmias that have shortness of breath as a sign or symptom. Providers should assess lung sounds to determine if there is any fluid buildup, a sign of acute heart failure. Determine if the shortness of breath is all the time, upon exertion, or at rest. Also, it is important to ask if the patient has been woken from sleep due to a shortness of breath. Sometimes arrhythmias occur at unexpected moments, even in the middle of the night (85).
Syncope was another common sign or symptom of cardiac arrhythmias due to decreased perfusion to the brain. Providers should determine if the patient currently feels lightheaded or dizzy, if they felt that way in the past, or if they have fainted. They should ask when this feeling happens—at rest, while moving, or both—and if they get any warning signs or auras beforehand. Always ensure you ask the patient to describe what happened so it can be added to the assessment (85).
A full medical history should be obtained, with a special focus on any past cardiac medical history the patient or their family has. Providers may consider asking the following questions:
- Have you been diagnosed with coronary artery disease, high blood pressure, peripheral vascular disease, valve problems, heart failure, high cholesterol, or other heart conditions?
- Have you had a heart attack or stroke in the past?
- Have you had any surgical procedures to help with your heart function? This may include things like ablation or stent placement.
Asking about medications can assist providers in determining any missed diagnoses with the patient while asking about social history can provide information about smoking, illicit drug use, alcohol consumption, and exercise habits (85).
Self Quiz
Ask yourself...
- Have you seen changes in the patients admitted to your facilities that you could correlate to these indications?
- Do you agree with this list? Is there anything you feel should be added or removed? Why?
- Are there any time frames (how long a patient is on a telemetry monitor) that you think should be adjusted?
- Do you think sending patients home with wearable monitors could be used in the future to prevent admission in some of the patients who meet the criteria for admission with telemetry?
Conclusion
Thanks to advancements within the medical profession, cardiac telemetry can be greatly beneficial to patients in and outside of the hospital setting. From devices you can carry, to devices implanted inside someone, patient outcomes have improved for identifying, treating, and managing cardiac arrhythmias that had once been deemed unmanageable. With proper knowledge of EKG rhythms, nurses can confidently provide the proper care for their patients by being an advocate for those they care for.
Heart Failure Updates
Introduction
In 1997, Heart Failure (HF) was designated an epidemic due to the significant increase in hospitalizations. (2) This increase in hospitalizations appears to be due to accurate management of HF patients who re-hospitalize for stabilization and medication management rather than a new diagnosis or end-stage disease.
HF occurs when the heart is too weak to pump blood to the body and lungs. The blood then backs up into the heart, lungs, and lower extremities, causing less blood supply to the body. HF can also be so severe that it can cause death in patients. (1)
It is crucial for nurses to understand the pathophysiology of HF, risk factors, and what education and treatment a nurse can incorporate in the plan of care, which will slow the progression of disease and maintain quality of life.
Self Quiz
Ask yourself...
- How can you find the costs associated with HF patients at your place of work? What treatments are helping manage HF patients?
- How would you assess an HF patient on your initial encounter as a nurse?
Statistical Evidence/Epidemiology
Epidemiologists study a disease's incidence, mortality, and prevalence to predict health care costs, how many people have a disease, how it affects society, and when the numbers of a disease change.
According to the CDC, there are approximately 6.2 million patients with heart failure in the United States. The diagnosis was noted on 13.8% of death certificates in 2018. (2) $30.7 billion was spent on HF in 2012, including health care costs, days away from work, and medications that treat HF.
Although HF is higher in the elderly population, the more significant number of patients ages 35 and above who die with HF are concentrated in the southeast, southwest, Indiana, Wisconsin, and Illinois, with some counties in Utah, Oregon, Montana, South Dakota, and Nebraska.
Readmission rates declined when the Hospital Readmission Reduction Program (HRRP) began in 2012 to reduce costs and deliver care more safely.
Hospitals are penalized by the Centers for Medicare and Medicaid to lower readmission rates to less than 30 days for some diagnoses, and HF was among them. Hospitals began to look closer at the readmission rates, which helped them to focus on improved management. (2) . Using the information below, nurses can better assess the patient and add more information to their care plan.
The classifications of HF as defined by the New York Heart Association are:
- No symptoms with regular physical activity.
- Some mild symptoms with physical activity but not at rest
- Comfortable at rest but with moderate symptoms with some minor physical activity.
- Severe shortness of breath with rest. (2)
Providers typically use echocardiograms to measure heart failure using the ejection fraction (EF) percentage. Ejection fraction demonstrates the blood pumping rate from the left ventricle to the body.
An EF of below 30% indicates severe disease, while an EF at or above 50% indicates milder or no condition. Left ventricular failure with an EF of 50% or above is considered HF with preserved EF. An EF of 30% or below is considered HF with reduced EF. There is now a new category called HF with mid-range, which shows an EF of 40%-50%.
Approximately 15% of the HF population shows mid-range EF.
Incidence - is the number of new disease cases in certain patients. In HF, this number also helps scientists understand how the prevalence of the disease results from a lifestyle change. These studies aid in determining the burden of HF on society, which in turn helps to make changes in public policy and, eventually, how HF patients are treated. "For HF, incidence as a measure of new cases is particularly helpful to assess how the occurrences of HF might have changed over time as a result of changes in risk factors." (2)
Prevalence - measures the commonality of a disease, in this case HF, in the at-risk population at or over a given time. It also measures how often an HF patient will be encountered. (6)
Mortality - CHF is one of the top causes of death. Mortality rates are high, and the data shows that 50% of HF patients die at or within five years of diagnosis. (2) More recent studies show mortality rates in HF are increasing, which may be due in part to an aging population.
Self Quiz
Ask yourself...
- Where can you find more information on the epidemiology of HF?
- Where do epidemiologists get their information?
- Can you define the difference between incidence and prevalence?
Etiology and Pathophysiology
Heart failure is often caused by an injury to the heart's muscle, such as Myocardial Infarction (MI), valvular regurgitation, stenosis of the heart's valves, and arrhythmia. (4) It is essential that the provider determines the cause to treat these patients appropriately.
The most common cause of HF is cardiovascular disease. When fatty deposits or plaque buildup in the vessels supplying the heart, the arteries become narrowed and decrease blood flow to the heart muscle. This can cause ischemia (lack of oxygen) to the area of the heart's power involved, causing an MI. This, in turn, causes damage to the heart's muscle, reducing its ability to pump normally.
There are two main types of HF:
- Left ventricular HF or systolic (LHF)
- Right ventricular HF or diastolic (RHF)
LHF occurs when the damage to the left ventricle occurs, and RHF occurs when the damage is to the right ventricle.
The following Table taken from the National Institutes of Health shows comorbidities for Systolic and Diastolic HF:
Systolic (LHF)
- Coronary Heart disease
- Arterial Hypertension
- Valvular Heart Disease
- Arrhythmias
- Inflammatory disease
- Idiopathic cardiomyopathy
- Toxic Cardiomyopathy (alcohol)
Diastolic (RHF)
- Diabetes Mellitus
- Arterial Hypertension
- Valvular Heart Disease (pressure load)
- Hypertrophic Cardiomyopathy
- Restrictive Cardiomyopathy
- Constrictive Pericarditis
- Amyloidosis (storage disease)
HF causes volume overload in the ventricles of the heart. This is due to enlargement and stiffness of the ventricles, so they cannot pump enough blood to the lungs and the body. (1,4) The nurse can utilize this information to care for the patient and implement essential treatments.
Genetics also play a role in HF but are varied and complex. Studies have found more than 100 genes that may contribute to cardiomyopathy. Depending on where the failure occurs, more genetic testing is recommended in some instances: Left, Right, or Biventricular determines what signs and symptoms may be present in a patient.
In a patient with an MI or volume/pressure overload, the whole heart will change in structure and function. There will be hypertrophy of the Left ventricle and the dilatation of the chambers, which will cause further deterioration in cardiac function. (4)
Certain medications may also lead to HF in some patients. These are the diabetic medications Actos and Avandia. NSAIDS (non-steroidal inflammatory drugs) and certain medicines that treat hypertension, cancer, blood dyscrasias, mental health, lung urinary issues, and infections. (1)
Aging also contributes as the heart's ability to work decreases over time. Too much alcohol and smoking are also important considerations. Heart failure may also cause complications such as kidney damage and failure, more heart problems, and liver disease caused by the backup of fluid that the liver cannot handle.
The photo below shows the difference between a normal heart and an enlarged one (12).
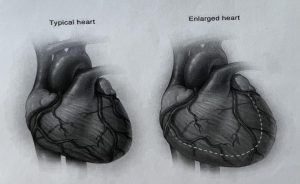
Preventable and non-preventable risk factors for heart disease are:
- Poor diet
- Smoking
- Lack of exercise
- Alcoholism
- Obesity
- Genetics/Race-non preventable
It is also known that Hispanic women are at higher risk for diabetes, which can lead to heart disease if their diabetes is not managed well. Also, African American men are at higher risk for heart disease, possibly leading to HF.
Interestingly, some studies have shown that the incidence of hospitalizations has declined. This may be due to early diagnosis, better use of medications and newer devices, earlier and ongoing patient education of risk factors, and stellar outpatient and preventive care of those patients living with HF or at risk in the community (2).
Self Quiz
Ask yourself...
- Why do you think certain diseases and medications contribute to heart disease?
- How would you plan to educate your new patient on this disease?
- What are the mechanisms of HF that may cause other diseases?
Diagnostic and Screening Tools for Heart Failure (HF)
Essential diagnostic screening tools are heart rate, cholesterol testing, blood pressure, and weight. Blood pressure measurement is one of the most critical tests since it can have no symptoms.
If high, it significantly increases the risk of cardiac disease. Fortunately, diet exercise can control blood pressure to lose weight if needed, and medications.
According to the American Heart Association, the standard for blood pressure is 120/80 or below and should be measured starting at age 20. (5) Next is the fasting cholesterol profile. Again, starting at age 20, a fasting lipid profile should be done. (5) This will give the provider and patient a baseline to follow and assist nurses in developing and implementing care plans.
The following chart describes lab values for cholesterol. As you can see, the values in red are at the highest risk for cardiovascular disease, which could lead to HF.
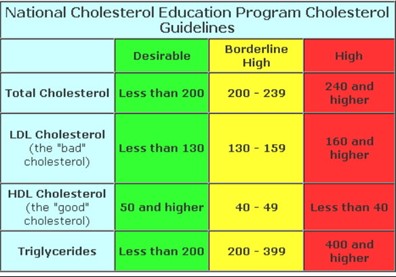
(13)
Body habitus is another crucial factor in predicting CAD. Body mass index (BMI), Waist measurements, and body structure can help predict how at risk a patient is for many diseases, including CAD, diabetes, atrial fibrillation, HF, and stroke. (7)
The typical Western diet is full of fats and sugars. In the US, many processed foods containing high salt, fat, and sugar are used.
These foods are unhealthy for the body and cause obesity and poor health. The Mediterranean diet, in turn, is full of fresh fruits and vegetables, lean meat, and a few processed foods. This is the most recommended diet for all populations.
High blood glucose is another indicator of poor health. Insulin resistance is the precursor to diabetes. A patient has insulin resistance when the body's muscles and tissues cannot respond to insulin, so glucose increases in the blood. (5)
Causes of insulin resistance are thought to be obesity with a large waist measurement. Blood glucose is usually tested with routine blood work. This gives the provider knowledge if a patient is at risk for diabetes and, therefore, heart disease. (5) Smoking and lack of physical activity can cause poor health, which may lead to cardiovascular disease.
Echocardiogram, Holter monitoring, stress tests, and nuclear stress tests are routinely used when a patient presents with symptoms of or has known cardiovascular disease. These tests provide a look at heart function and are used to determine disease progression or maintenance.
Self Quiz
Ask yourself...
- What are the waist measurements in males and females that are considered for a diagnosis of obesity?
- How would you care for a patient undergoing this testing using the nursing process?
- Why is diabetes a risk factor for HF?
Medication Management
Treating HF with medications can reduce disease progression, and relieve symptoms of dyspnea, fatigue, and edema. Several classes of drugs can be used to treat HF. Each one may be used to treat a different symptom.
The classes are as follows:
Angiotensin-Converting Enzyme (ACE) Inhibitors
These medications open blood vessels decreasing blood pressure and lowering the heart’s work to keep HF from worsening. (6)
Some common ACE inhibitors are:
- Captopril
- Enalapril
- Lisinopril
- Ramipril
Angiotensin-Receptor Blockers (Arbs)
- Losartan
- Valsartan
Angiotensin-Receptor Neprilysin Inhibitors (Arnis)
Entresto is a drug combination in the class of Angiotensin-receptor neprilysin inhibitors (ARNIs). ARNIs limit the enzyme neprilysin from breaking down natural substances in the body. By limiting this enzyme, the arteries can open to increase blood flow. This drug also limits the retention of sodium. (7)
Beta Blockers
Beta-blockers work to slow down the heart rate and increase blood flow by widening blood vessels. This also lowers blood pressure. (9)
Common Beta Blockers are:
- Atenolol
- Bisoprolol
- Carvedilol
- Labetalol
- Metoprolol succinate
- Metoprolol tartrate
- Nadolol
- Propranolol
Sodium-Glucose Cotransporter-2 (SGLT2) Inhibitors
Jardiance and Farxiga are Sodium-glucose cotransporter-2 (SGLT2) inhibitors that were designed to treat diabetes, but they have been found to be cardio-protective. (7)
Diuretics
Diuretics allow the body to release extra fluid and sodium through the kidneys. They cause increased urination so should be taken earlier in the day.
Most common diuretics are:
- Lasix
- Bumex
- Torsemide
- Diuril
- Hydrochlorothiazide (HCTZ)
- Metolazone
Other medications can be prescribed depending on the patient's needs, such as anticoagulants to keep the blood thin, statins to lower cholesterol, and Digoxin to control heart rate and increase pumping strength. Calcium channel blockers allow the heart muscle to relax, thereby reducing blood pressure and circulation within the heart. Potassium may be used with certain diuretics that cause potassium to leave the body.
It is needed to keep the heart's rhythm in control. Oxygen may also increase its amount in the blood, assisting with dyspnea and activity tolerance. (7) It is the nurse's responsibility to evaluate these medications and interventions for plan updates.
Self Quiz
Ask yourself...
- Which medications are the first line in controlling HF?
- Where can you find side effects of these medications?
- What would your care plan look like for a patient with HF?
Other Interventions
Several types of surgery can be utilized for the most severe cases of HF. Bypass surgery has been used for many years. This procedure bypasses blocked coronary arteries, allowing for better blood flow to the heart muscle.
Replacing damaged or stenosed heart valves will assist blood flow within the heart chambers. In some patients, biventricular pacing with a pacemaker allows both sides of the heart to work in sync. (10) An ICD, or implantable defibrillator, can shock the heart from a life-threatening rhythm back to normal.
The ventricular assist device or VAD can assist the ventricles to pump blood out to the body. (10) This device can be used either waiting for a transplant or permanently.
Heart Transplants can be used as the last intervention, with a success rate of 88% after one year and 75% after five. If a patient has sleep apnea, it can be linked to heart failure. In this case, an evaluation and treatment will be performed. (10)
Self Quiz
Ask yourself...
- Where can you learn more about assistive devices for HF?
- How many arteries can be bypassed in surgery at one time?
- How would you care for a person with a surgical device?
Current areas of research in HF are producing more effective drug therapy, genetic testing, non-surgical devices, transplants, and mechanical support. (8)
The research is now studying drugs that improve physical symptoms when added to the standard drug treatment and care. These drugs have shown improvement in reducing hospitalizations.
The newer diabetic medications Jardiance, Invokana, and Farxiga are being studied on HF patients without diabetes to learn if they will improve function and risk reduction of MI, stroke, or cardiovascular death. (8)
Non-invasive imaging such as MRI, ultrasound, nuclear testing, and radiology are being researched in the hope that advancing these technologies will "provide additional information about coronary arteries and heart tissue, coronary strain, the function and structure of the heart." (8)
Genetic testing is under investigation to help determine if there is an inherited disease, especially in specific cardiomyopathies. These cardiomyopathies present differently and may be treated with differing modalities.
One of the newest areas of HF management and treatment is remote monitoring. Nurses are at the forefront of home monitoring in many areas as they are the clinicians making home visits.
New types of VADs are emerging as treatments for advanced illnesses. They are being manufactured to be more durable and portable. (8)
Self Quiz
Ask yourself...
- Where can you find new research studies on HF?
- Where can you go to get educated on new devices?
- Who is conducting the new research?
Conclusion
As discussed in this course, Heart Failure affects over 6 million people in the US. Age, lifestyle, race, and genetics may predispose a patient to this disease.
HF burdens society and health care costs due to missed work, rehospitalizations, and poor outcomes. As a nurse, learning the mechanisms of HF is imperative. Understanding etiology, statistics, pharmaceuticals, and other interventions will assist nurses in administering the best care.
New research shows how emerging medications, improved implantable devices, and surgery can improve outcomes. However, patient education and prevention are vital to caring for HF patients.
References + Disclaimer
- Anusiewicz, C. V., Ivankova, N. V., Swiger, P. A., Gillespie, G. L., Li, P., & Patrician, P. A. (2020). How does workplace bullying influence nurses’ abilities to provide patient care? a nurse perspective. Journal of Clinical Nursing, 29(21-22), 4148–4160. https://doi.org/10.1111/jocn.15443
- Collins, B. (2022). Mobbing and workplace bullying among registered nurses in Mississippi. ABNFF Journal, 1(2), 20–28.
- Edmonson, C., & Zelonka, C. (2019). Our own worst enemies. Nursing Administration Quarterly, 43(3), 274–279. https://doi.org/10.1097/naq.0000000000000353
- Harassment definition & meaning. (n.d.). Dictionary.com. https://www.dictionary.com/browse/harassment
- Meires, J. (2018). Workplace incivility – the essentials: Here’s what you need to know about bullying in nursing. Urologic Nursing, 38(2), 95. https://doi.org/10.7257/1053-816x.2018.38.2.95
- Thompson, R. (Feb 2022). Getting Clear on Bullying Versus Incivility. Florida Nurse, 70(1), 19–19.
- Agency for Healthcare Research and Quality (AHRQ). (2021). Benchmarking for Quality Improvement. https://digital.ahrq.gov/health-it-tools-and-resources/evaluation-resources/workflow-assessment-health-it-toolkit/all-workflow-tools/benchmarking
- Agency for Healthcare Research and Quality (AHRQ). (2021). Data Collection and Management. https://www.ahrq.gov/talkingquality/measures/data-collection.html
- Agency for Healthcare Research and Quality (AHRQ). (2021). Nursing-sensitive indicators: AHRQ quality indicators. https://www.qualityindicators.ahrq.gov/Modules/nursing-sensitive_indicators.aspx
- Agency for Healthcare Research and Quality (AHRQ). (2019). TeamSTEPPS 2.0: Strategies and Tools to Enhance Performance and Patient Safety. https://www.ahrq.gov/teamstepps/index.html
- Agency for Healthcare Research and Quality (AHRQ). (2021). Types of Measures. https://www.ahrq.gov/talkingquality/measures/types.html
- Centers for Medicare & Medicaid Services (CMS). (2021). Quality Improvement and Evaluation System (QIES). https://www.cms.gov/medicare/health-safety-standards/quality-safety-oversight-general-information/iqies
- Deming, W. E. (1986). Out of the Crisis. MIT Press.
- Dowding, D., Randell, R., Gardner, P., Fitzpatrick, G., Dykes, P., & Favela, J. (2019). Dashboards for improving patient care: Review of the literature. International Journal of Medical Informatics, 124, 87-97. https://doi.org/10.1016/j.ijmedinf.2019.01.008
- Feldstein, A. C., Glasgow, R. E., Smith, D. H., & Aickin, M. (2019). Six-Sigma: A case study in a community health center. The Joint Commission Journal on Quality and Patient Safety, 45(2), 96-104. doi:10.1016/j.jcjq.2018.05.002
- George, M. L. (2020). Lean Six Sigma for Service: How to Use Lean Speed and Six Sigma Quality to Improve Services and Transactions (2nd ed.). McGraw-Hill Education.
- George, M. L., Rowlands, D., & Price, M. (2015). The Lean Six Sigma Pocket Tool book: A Quick Reference Guide to 100 Tools for Improving Quality and Speed. McGraw-Hill Education.
- Institute for Healthcare Improvement (IHI). (2020). Introduction to Quality Improvement. https://www.ihi.org/education/IHIOpenSchool/Courses/Pages/QualityImprovement.aspx
- Institute for Healthcare Improvement. (2019). What is Quality Improvement? https://www.ihi.org/education/IHIOpenSchool/Courses/Pages/QualityImprovement.aspx
- Institute of Medicine (IOM). (2001). Crossing the Quality Chasm: A New Health System for the 21st Century. National Academies Press.
- Johnson, J. K., & Jolivet, R. R. (2018). Applying Kotter’s 8-Step Change Model in Nursing. Nurse Leader, 16(2), 117-119. https://doi.org/10.1016/j.mnl.2017.09.005
- Joynt Maddox, K. E., Orav, E. J., Zheng, J., Epstein, A. M. (2018). Evaluation of Medicare’s Bundled Payments Initiative for Medical Conditions. New England Journal of Medicine, 379(3), 260-269. doi:10.1056/NEJMsa1801569
- Langley, G. J., Moen, R. D., Nolan, K. M., Nolan, T. W., Norman, C. L., & Provost, L. P. (2009). The Improvement Guide: A Practical Approach to Enhancing Organizational Performance. Jossey-Bass.
- Leonard, M., Graham, S., & Bonacum, D. (2004). The human factor: Effective teamwork and communication is critical in providing safe care. Quality and Safety in Health Care, 13(Suppl 1), i85-i90. doi:10.1136/qshc.2004.010033
- Mazzocato, P., Savage, C., Brommels, M., Aronsson, H., & Thor, J. (2010). Lean thinking in healthcare: A realist review of the literature. Quality & Safety in Health Care, 19(5), 376-382. doi:10.1136/qshc.2009.037986
- National Academies of Sciences, Engineering, and Medicine. (2018). Crossing the Global Quality Chasm: Improving Health Care Worldwide. National Academies Press.
- National Quality Forum (NQF). (2021). Safe Practices for Better Healthcare – 2021-2022. https://www.qualityforum.org/News_And_Resources/Press_Kits/Safe_Practices_for_Better_Healthcare.aspx
- Radnor, Z. J., & Holweg, M. (2012). Lean in healthcare: The unfilled promise? Social Science & Medicine, 74(3), 364-371. doi:10.1016/j.socscimed.2011.02.011
- Schweickert, P., Keller, M., & Reber, A. (2019). Using data to drive quality improvement in nursing: A guide. Journal of Nursing Management, 27(7), 1404-1408. https://doi.org/10.1111/jonm.12829
- Wheeler, D. J. (2003). Deming’s Profound Changes: When Will the Sleeping Giant Awaken? SPC Press.
- Womack, J. P., Jones, D. T., & Roos, D. (2019). The Machine That Changed the World: The Story of Lean Production–Toyota’s Secret Weapon in the Global Car Wars That Is Now Revolutionizing World Industry. Free Press.
- Arnetz, J. E. (2022, April). The Joint Commission’s new and revised Workplace violence prevention standards for hospitals: A major step forward toward improved quality and safety. Joint Commission journal on quality and patient safety. https://www.ncbi.nlm.nih.gov/pmc/articles/PMC8816837/
- American Nurses Association. (2019, January). Reporting incidents of Workplace Violence – Ana Enterprise. Reporting Incidents of Workplace Violence. https://www.nursingworld.org/~495349/globalassets/docs/ana/ethics/endabuse-issue-brief-final.pdf
- Occupational Safety and Health Administration. (n.d.). Healthcare – workplace violence. https://www.osha.gov/healthcare/workplace-violence/
- Minnesota Nurses Association. (2022, August 10). Hennepin Healthcare Nurses report rising violence against nurses and patients, cite under-staffing, unresponsive management as barriers in new survey. Minnesota Nurses Association. https://mnnurses.org/hennepin-healthcare-nurses-report-rising-violence-against-nurses-and-patients-cite-under-staffing-unresponsive-management-as-barriers-in-new-survey/
- ANA) Workplace violence. (2017). https://www.nursingworld.org/practice-policy/advocacy/state/workplace-violence2/
- Sahebi, A., Golitaleb, M., Moayedi, S., Torres, M., & Sheikhbardsiri, H. (2022, August 8). Prevalence of workplace violence against health care workers in hospital and pre-hospital settings: An umbrella review of meta-analyses. Frontiers in public health. https://www.ncbi.nlm.nih.gov/pmc/articles/PMC9393420/#:~:text=The%20overall%20prevalence%20of%20WPV,%2C%20and%2010.5%25%20(95%25
- Song, C., Wang, G., & Wu, H. (2020, December 3). Frequency and barriers of reporting workplace violence in nurses: An online survey in China. International Journal of Nursing Sciences. https://www.ncbi.nlm.nih.gov/pmc/articles/PMC7859538/
- Staff, A. (2022, November 4). End Nurse Abuse: 4 Actions You Can Take Today. Aorn.org. https://www.aorn.org/article/2021-12-03-End-Nurse-Abuse
- Fountain, D., Zankowski, D., & Arriola, J. (n.d.). Reporting incidents of Workplace Violence – Ana Enterprise. Reporting incidents of Workplace Violence. https://www.nursingworld.org/~495349/globalassets/docs/ana/ethics/endabuse-issue-brief-final.pdf
- S. Bureau of Labor Statistics. (n.d.). Workplace violence in healthcare, 2018. U.S. Bureau of Labor Statistics. https://www.bls.gov/iif/factsheets/workplace-violence-healthcare-2018.htm
- Vincent-Höper, S., Stein, M., Nienhaus, A., & Schablon, A. (2020, May 1). Workplace aggression and burnout in nursing-the moderating role of follow-up counseling. International journal of environmental research and public health. https://www.ncbi.nlm.nih.gov/pmc/articles/PMC7246829/
- Creating a culture of safety in nursing. ANA. (2023, September 12). https://www.nursingworld.org/resources/individual/nurse-managers/safety-in-nursing/
- AlGhatrif, M., & Lindsay, J. (2012). A brief review: History to understand fundamentals of electrocardiography. Journal of Community Hospital Internal Medicine Perspectives, 2(1), 14383. https://doi.org/10.3402/jchimp.v2i1.14383
- Alila Medical Media. (2017). Cardiac action potential, animation. [YouTube Video]. In YouTube. https://www.youtube.com/watch?v=v7Q9BrNfIpQ
- American Heart Association. (2016). Ventricular fibrillation. Www.heart.org. https://www.heart.org/en/health-topics/arrhythmia/about-arrhythmia/ventricular-fibrillation
- Atkielski, A. (2023). PQRST segment. In StatPearls. https://www.ncbi.nlm.nih.gov/books/NBK551635/figure/article-20939.image.f1/?report=objectonly
- Benzoni, T., & Cascella, M. (2021). Procedural sedation. PubMed; StatPearls Publishing. https://www.ncbi.nlm.nih.gov/books/NBK551685/
- Bern Dibner. (2018). Luigi Galvani | Italian physician and physicist. In Encyclopædia Britannica. https://www.britannica.com/biography/Luigi-Galvani
- Birnbaum, Y., Ye, Y., Smith, S. W., & Jneid, H. (2021). Rapid diagnosis of STEMI equivalent in patients with left bundle‐branch block: Is it feasible? Journal of the American Heart Association, 10(18). https://doi.org/10.1161/jaha.121.023275
- Bracey, A. (2023). Posterior MI. In nlm.nih.gov. https://www.ncbi.nlm.nih.gov/books/NBK553168/figure/article-698.image.f1/?report=objectonly
- Burns, E., & Buttner, R. (2021). PVCs. In com. https://litfl.com/premature-ventricular-complex-pvc-ecg-library/
- Burns, E., & Buttner, R. (2023a). Anterior MI. In com. https://litfl.com/anterior-myocardial-infarction-ecg-library/)
- Burns, E., & Buttner, R. (2023b). Monomorphic vtach. In com. https://litfl.com/ventricular-tachycardia-monomorphic-ecg-library/
- Burns, E., & Buttner, R. (2023c). Torsades de Pointes. In com. https://litfl.com/polymorphic-vt-and-torsades-de-pointes-tdp/
- Cadogan, M. (2018, August 1). Delta wave. Life in the Fast Lane. https://litfl.com/delta-wave-ecg-library/
- Cadogan, M. (2022). Lead positioning. In com. https://litfl.com/ecg-lead-positioning/
- Cardiac Science. (2021). ECG graph paper. In ca. https://cardiacsciencesmb.ca/ecg-graph-paper/
- Cardogan, M., & Buttner, R. (2021). Sgarbossa criteria. In com. https://litfl.com/sgarbossa-criteria-ecg-library
- Cascino, T., & Shea, M. (2022, September). Electrocardiography – cardiovascular disorders. MSD Manual Professional Edition. https://www.msdmanuals.com/professional/cardiovascular-disorders/cardiovascular-tests-and-procedures/electrocardiography
- Center for Advanced Cardiac and Vascular Interventions. (2023). Mobile cardiac telemetry (MCT). Center for Advanced Cardiac and Vascular Interventions. https://cacvi.org/services/diagnostic-procedures/mobile-cardiac-telemetry/
- Center for Drug Evaluation and Research. (2021, January 8). FDA drug safety communication: New information regarding QT prolongation with ondansetron (zofran). https://www.fda.gov/drugs/drug-safety-and-availability/fda-drug-safety-communication-new-information-regarding-qt-prolongation-ondansetron-zofran
- Chruścik, A., Kauter, K., Windus, L., & Whiteside, E. (2021). 6.2 cardiac muscle and electrical activity. In pressbooks.pub. University of Southern Queensland. https://usq.pressbooks.pub/anatomy/chapter/6-2-cardiac-muscle-and-electrical-activity/
- Cleveland Clinic. (2022a). Asystole. In clevelandclinic.org. https://my.clevelandclinic.org/health/symptoms/22920-asystole
- Cleveland Clinic. (2022b, June 3). Pulseless electrical activity (PEA): Causes and treatment. Cleveland Clinic. https://my.clevelandclinic.org/health/symptoms/23213-pulseless-electrical-activity
- Cleveland Clinic. (2022c, June 11). Cardiac event monitor: Types and uses. Cleveland Clinic. https://my.clevelandclinic.org/health/diagnostics/23272-cardiac-event-monitor
- Clip Art Library. (2023). EKG machine. In https://clipart-library.com/clipart/2049261.htm.
- Cohagan, B., & Dov Brandis. (2019, February 17). Torsade de Pointes. Nih.gov; StatPearls Publishing. https://www.ncbi.nlm.nih.gov/books/NBK459388/
- Costa, C. (2016). Figure 2.1: A) basic cardiac anatomy and blood circulation through the… In ResearchGate. ResearchGate. https://www.researchgate.net/figure/A-Basic-cardiac-anatomy-and-blood-circulation-through-the-hearts-cavities-and-valves_fig20_320411039
- de Jong, J. (2007a). 2nd AV block. In org. https://en.ecgpedia.org/index.php?title=File:Wenckebach2.png
- de Jong, J. (2007b). A fib. In org. https://en.ecgpedia.org/index.php?title=File:Afib_ecg.jpg
- de Jong, J. (2007c). Normal sinus rhythm. In org. https://en.ecgpedia.org/index.php?title=File:Nsr.jpg
- de Jong, J. (2008). SVT. In org. https://en.ecgpedia.org/index.php?title=File:Avrt_small.svg
- de Jong, J. (2009). A flutter. In org. https://en.ecgpedia.org/index.php?title=File:ECG000011.jpg
- de Jong, J. (2010a). 1st AV block. In org. https://en.ecgpedia.org/index.php?title=File:Rhythm_1stAVblock.png
- de Jong, J. (2010b). 3rd AV block. In org. https://en.ecgpedia.org/index.php?title=File:Rhythm_3rdAVblock.png
- de Jong, J. (2010c). A fib RVR. In org. https://en.ecgpedia.org/index.php?title=File:Afib_f_VR_ecg.jpg
- de Jong, J. (2010d). Bigeminy PVC. In org. https://en.ecgpedia.org/index.php?title=File:Rhythm_bigemini.png
- de Jong, J. (2010e). Idioventricular rhythm. In org. https://en.ecgpedia.org/index.php?title=File:Rhythm_idioventricular.png
- de Jong, J. (2010f). PAC. In org. https://en.ecgpedia.org/index.php?title=File:Rhythm_premature.png
- de Jong, J. (2010g). PVCs. In org. https://en.ecgpedia.org/index.php?title=File:Rhythm_ventricular_premature.png
- de Jong, J. (2010h). Ventricular fibrillation. In org. https://en.ecgpedia.org/index.php?title=File:Rhythm_ventricular_fibrillation.png
- de Jong, J. (2011a). Mobitz. In org. https://en.ecgpedia.org/index.php?title=File:Rhythm_Mobitz.png
- de Jong, J. (2011b, December 13). Normal tracing. En.ecgpedia.org. https://en.ecgpedia.org/index.php?title=Normal_Tracing
- de Jong, J. (2011c). Sinus tachycardia. In org. https://en.ecgpedia.org/index.php?title=File:Rhythm_tachycardia.png
- Dmitriy Scherbak, & Hicks, G. J. (2019, April 7). Left bundle branch block (LBBB). Nih.gov; StatPearls Publishing. https://www.ncbi.nlm.nih.gov/books/NBK482167/
- Douedi, S., & Douedi, H. (2020). P wave. PubMed; StatPearls Publishing. https://www.ncbi.nlm.nih.gov/books/NBK551635/
- Foth, C., Manesh Kumar Gangwani, & Alvey, H. (2020, January 13). Ventricular Tachycardia (VT, V Tach). Nih.gov; StatPearls Publishing. https://www.ncbi.nlm.nih.gov/books/NBK532954/
- Foth, C., & Mountfort, S. (2022). Acute myocardial infarction ST elevation (STEMI). National Library of Medicine; StatPearls Publishing. https://www.ncbi.nlm.nih.gov/books/NBK532281/
- Gangwani, M. K., & Nagalli, S. (2020). Idioventricular rhythm. PubMed; StatPearls Publishing. https://www.ncbi.nlm.nih.gov/books/NBK554520/
- GE HealthCare. (2023a). Apexpro ch telemetry system patient monitors. Www.gehealthcare.com. https://www.gehealthcare.com/products/patient-monitoring/patient-monitors/apexpro-ch-telemetry-system
- GE HealthCare. (2023b). Cardiac beside monitor. In com. https://www.gehealthcare.com/products/patient-monitoring/patient-monitors/carescape-monitor-b650
- Glenlarson . (2023). Inferior MI. In nlm.nih.gov. https://www.ncbi.nlm.nih.gov/books/NBK470572/figure/article-23500.image.f1/?report=objectonly
- Gray, D. (2016). How to read an electrocardiogram (EKG/ECG) (K. Gaines , Ed.). Nurse.org. https://nurse.org/articles/how-to-read-an-ECG-or-EKG-electrocardiogram/
- Hafeez, Y., & Grossman, S. A. (2020). Junctional rhythm. PubMed; StatPearls Publishing. https://www.ncbi.nlm.nih.gov/books/NBK507715/
- Harkness, W. T., & Hicks, M. (2019, June 3). Right bundle branch block (RBBB). Nih.gov; StatPearls Publishing. https://www.ncbi.nlm.nih.gov/books/NBK507872/
- Heaton, J., & Yandrapalli, S. (2021). Premature atrial contractions. PubMed; StatPearls Publishing. https://www.ncbi.nlm.nih.gov/books/NBK559204/
- Henning, A., & Krawiec, C. (2022, August 8). Sinus tachycardia. PubMed; StatPearls Publishing. https://www.ncbi.nlm.nih.gov/books/NBK553128/
- Ibrahim, H. (2022a, May 19). ECG tip 20. what about “orthodromic” SVT?youtube.com. https://www.youtube.com/watch?v=XcnU7mGKdis
- Ibrahim, H. (2022b, May 24). ECG tip 21. what about “antidromic” SVT?youtube.com. https://www.youtube.com/watch?v=qTaNeoGEKJc
- Johns Hopkins Medicine. (2019). Holter monitor. John Hopkins Medicine. https://www.hopkinsmedicine.org/health/treatment-tests-and-therapies/holter-monitor
- Jordan, M. R., Lopez, R. A., & Morrisonponce, D. (2020). Asystole. PubMed; StatPearls Publishing. https://www.ncbi.nlm.nih.gov/books/NBK430866/
- Mangi, M. A., Jones, W. M., & Napier, L. (2019, November 6). Atrioventricular block second-degree. Nih.gov; StatPearls Publishing. https://www.ncbi.nlm.nih.gov/books/NBK482359/
- Mayo Clinic. (2017). Implantable cardioverter-defibrillators (ICDs). Mayoclinic.org. https://www.mayoclinic.org/tests-procedures/implantable-cardioverter-defibrillators/about/pac-20384692
- Mayo Clinic. (2019). Acute coronary syndrome – symptoms and causes. Mayo Clinic. https://www.mayoclinic.org/diseases-conditions/acute-coronary-syndrome/symptoms-causes/syc-20352136
- Mayo Clinic. (2023, July 26). Atrial fibrillation – symptoms and causes. Mayo Clinic. https://www.mayoclinic.org/diseases-conditions/atrial-fibrillation/symptoms-causes/syc-20350624
- McMurray, P. (2018). PVCs multiform. In com. https://bossrn.com/pvc
- Miner, B., Grigg, W. S., & Hart, E. H. (2020a). Wellens syndrome. PubMed; StatPearls Publishing. https://www.ncbi.nlm.nih.gov/books/NBK482490/
- Mountfort, S. (2023). Lateral MI. In nlm.nih.gov. https://www.ncbi.nlm.nih.gov/books/NBK537228/figure/article-24110.image.f2/?report=objectonly
- National Heart, Lung, and Blood Institute. (2022). Atherosclerosis . In nih.gov. https://www.nhlbi.nih.gov/health/atherosclerosis
- Oldroyd, S. H., & Makaryus, A. N. (2020). First degree heart block. PubMed; StatPearls Publishing. https://www.ncbi.nlm.nih.gov/books/NBK448164/
- Osmosis by Elsevier. (2023). Cardiac electrophysiology notes: Diagrams & illustrations. Www.osmosis.org. https://www.osmosis.org/notes/Cardiac_Electrophysiology#page-1
- Oxford Medical Education. (n.d.). ECG (EKG) – bundle branch block. Oxford Medical Education. https://oxfordmedicaleducation.com/ecgs/bundle-branch-block/
- Parker, S. (n.d.). Telemetry – MeSH – NCBI. Www.ncbi.nlm.nih.gov. Retrieved September 8, 2023, from https://www.ncbi.nlm.nih.gov/mesh/?term=telemetry
- Patti, L., & Ashurst, J. V. (2019, June 4). Supraventricular tachycardia (SVT). Nih.gov; StatPearls Publishing. https://www.ncbi.nlm.nih.gov/books/NBK441972/
- Rodriguez Ziccardi, M., Goyal, A., & Maani, C. V. (2020). Atrial flutter. PubMed; StatPearls Publishing. https://www.ncbi.nlm.nih.gov/books/NBK540985/
- RWJ Barnabas Health. (2023). Telemetry monitor technician. In org. https://www.rwjbh.org/community-medical-center/treatment-care/heart-and-vascular-care/programs-and-specialties/centralized-cardiac-telemetry-monitoring-program/
- Sandau, K. E., Funk, M., Auerbach, A., Barsness, G. W., Blum, K., Cvach, M., Lampert, R., May, J. L., McDaniel, G. M., Perez, M. V., Sendelbach, S., Sommargren, C. E., & Wang, P. J. (2017). Update to practice standards for electrocardiographic monitoring in hospital settings: A scientific statement from the American Heart Association. Circulation, 136(19). https://doi.org/10.1161/cir.0000000000000527
- Sattar, Y. (2023). Lead placement. In StatPearls. https://www.ncbi.nlm.nih.gov/books/NBK549803/figure/article-20969.image.f1/?report=objectonly
- Sklavos, T. (2020, November 3). ECG interpretation: Myocardial ischaemia and infarction. LITFL. https://litfl.com/ecg-interpretation-myocardial-ischaemia-and-infarction/
- Slane, M., Knabben, V., & Chhabra, L. (2019). Third-Degree atrioventricular block. Nih.gov; StatPearls Publishing. https://www.ncbi.nlm.nih.gov/books/NBK545199/
- Smith, S. (2014). Wide complex SVT. In hqmeded-ecg.blogspot.com. https://hqmeded-ecg.blogspot.com/2014/12/wide-complex-tachycardia-lewis-leads-do.html
- Vincent’s Hospital. (n.d.). Holter monitor. In svhhearthealth.com.au. https://www.svhhearthealth.com.au/Images/UserUploadedImages/976/10_HolterMonitor.jpg
- Thanassoulis, G., & Aziz, H. (2018). Atherosclerosis. Merck Manuals Professional Edition; Merck Manuals. https://www.merckmanuals.com/professional/cardiovascular-disorders/arteriosclerosis/atherosclerosis
- The Univeristy of Nottingham. (n.d.-a). Bipolar Leads. Www.nottingham.ac.uk. https://www.nottingham.ac.uk/nursing/practice/resources/cardiology/function/bipolar_leads.php
- The University of Nottingham. (n.d.-b). Limb leads. Www.nottingham.ac.uk. https://www.nottingham.ac.uk/nursing/practice/resources/cardiology/function/limb_leads.php
- University of Utah Health. (n.d.). ECG learning center – an introduction to clinical electrocardiography. Utah.edu. https://ecg.utah.edu/lesson/9
- Wisconsin Technical College System. (2021). 3 cardiovascular assessment. Wtcs.pressbooks.pub. https://wtcs.pressbooks.pub/nursingskills/chapter/9-3-cardiovascular-assessment/
- Wong, E. (2013). Action potential of cardiac muscles. In org. http://www.pathophys.org/physiology-of-cardiac-conduction-and-contractility/actionpotential/
- Yamama Hafeez, & Grossman, S. A. (2019, November 18). Sinus bradycardia. Nih.gov; StatPearls Publishing. https://www.ncbi.nlm.nih.gov/books/NBK493201/
- Yasar Sattar, & Hashmi, M. F. (2019, December 3). Ventricular premature complexes. Nih.gov; StatPearls Publishing. https://www.ncbi.nlm.nih.gov/books/NBK547713/
- Zeid Nesheiwat, Amandeep Goyal, & Mandar Jagtap. (2022). Atrial fibrillation . Nih.gov; StatPearls Publishing. https://www.ncbi.nlm.nih.gov/books/NBK526072/
- Zimmermann, P., & Hammond, B. (2023). Sheehy’s manual of emergency care. (8th ed.). Elsevier Health Sciences.
- ZOLL Medical Corporation. (2023). X series cardiac monitor/defibrillator for EMS – ZOLL medical. Www.zoll.com. https://www.zoll.com/products/defibrillators/x-series-for-ems
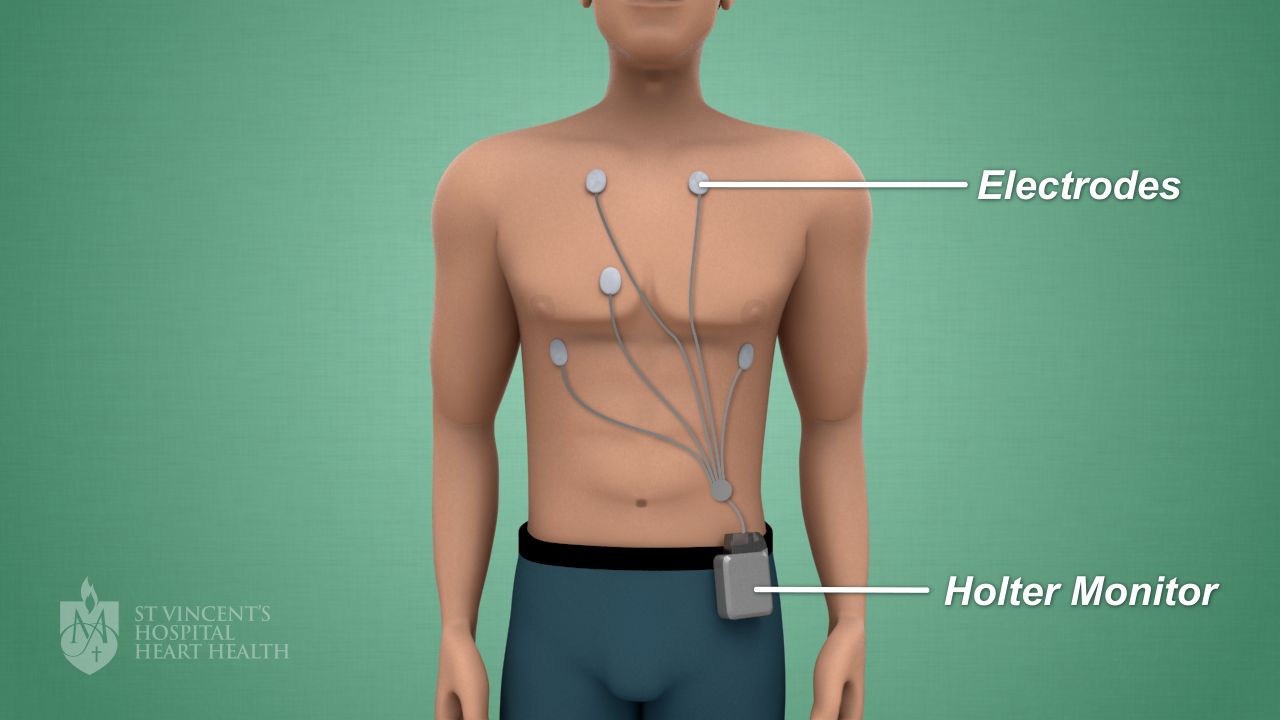
- Mayo Clinic Staff. Heart Failure at Mayo Clinic as retrieved from: https://www.ahajournals.org/doi/10.116/CIRCRESAHA.121.318172
- Roger, Veronique L., Epidemiology of Heart Failure. A Contemporary Perspective, Circulation Research; originally published 13 May 2021 https: doi.org/10.16/CIRCRESAHA.121.318172. Circulation Research, 2021 128:1421-1434
- Centers for Disease Control and Prevention. CDC.gov. Article: Heart Failure. retrieved https://www.cdc.gov/heartdisease/heart_failure.htm
- Schwinger, Robert H.G. Pathophysiology of heart failure. 2021 Feb;11 (1):263-276 doi: 10.21037-20-302. Retrieved from: https//: ncbinim,nih.gov/pmc/articles/PMC7944197/
- American Red Cross. Heart-Health Screenings. Retrieved from: https://www.heart.org/en/health-topics/consumer-healthcare/what-is-cardiovascular-disease/heart-health-screenings.
- Mayo Clinic Staff. Heart Failure. Retrieved from: https://www.mayoclinic.org/diseases-conditions/heart-failure/diagnosis-treatment/treatment/txc-20373144
- American Heart Association article. Medications Used to Treat Heart Failure. Retrieved from: https://www.heart.org/en/health-topics/heart-failure/treatment-options-for-heart-failure/medications-used-to-treat-heart-failure
- Editorial Team. Emerging Heart Failure Research. Retrieved from: https://heart-failure.net/research
- Mayo Clinic Staff. Beta Blockers. Retrieved from: https://www.mayoclinic.org/diseases-conditions/high-blood-pressure/in-depth/beta-blockers/art-20044522
- Johns Hopkins Medicine. Congestive Heart Failure: Prevention, Treatment and Research. Retrieved from: https://www.hopkinsmedicine.org/health/wellnss-and-prevention/heart-health. https://www.hopkinsmedicine.org/health/heart-and-vascular. Ventricular Assist Device (VAD) | Conditions & Treatments | UCSF Health. https://www.hopkinsmedicine.org/health/wellness-and-prevention/heart-conditions’
- University of Southern California Health. Ventricular Assist Device Retrieved from: https://www.ucsfhealth.org/treatments/ventricular-assist-device,
- Figure 1. Mayo Clinic mayoclinic.org/diseases-conditions/heart-failure/symptoms-causes/syc-2037314
- Figure 2. Healthy-Ojas Healthy Cholesterol Range. healthy-ojas.com/cholesterol/healthy-cholesterol-level.html
Disclaimer:
Use of Course Content. The courses provided by NCC are based on industry knowledge and input from professional nurses, experts, practitioners, and other individuals and institutions. The information presented in this course is intended solely for the use of healthcare professionals taking this course, for credit, from NCC. The information is designed to assist healthcare professionals, including nurses, in addressing issues associated with healthcare. The information provided in this course is general in nature and is not designed to address any specific situation. This publication in no way absolves facilities of their responsibility for the appropriate orientation of healthcare professionals. Hospitals or other organizations using this publication as a part of their own orientation processes should review the contents of this publication to ensure accuracy and compliance before using this publication. Knowledge, procedures or insight gained from the Student in the course of taking classes provided by NCC may be used at the Student’s discretion during their course of work or otherwise in a professional capacity. The Student understands and agrees that NCC shall not be held liable for any acts, errors, advice or omissions provided by the Student based on knowledge or advice acquired by NCC. The Student is solely responsible for his/her own actions, even if information and/or education was acquired from a NCC course pertaining to that action or actions. By clicking “complete” you are agreeing to these terms of use.
➁ Complete Survey
Give us your thoughts and feedback
➂ Click Complete
To receive your certificate