Course
Telemetry and EKG Basics: Rhythm Recognition
Course Highlights
- In this Telemetry and EKG Basics: Rhythm Recognition course, you will learn to recognize the importance of the many telemetry devices used and identify how these devices impact patient care.
- You’ll also learn how to properly recall lead placement for the standard 5 lead, 12 lead, 15 lead, and right-sided EKGs.
- You’ll leave this course with the ability to correctly identify each type of cardiac rhythm discussed in this course and be able to list at least three signs and symptoms, three causes, and three treatments for each abnormal rhythm.
About
Contact Hours Awarded: 3
Course By: Kayla M. Cavicchio
MSN, RN, CEN
Begin Now
Read Course | Complete Survey | Claim Credit
➀ Read and Learn
The following course content
Introduction
To truly understand telemetry, nurses must have knowledge about the anatomy of the heart and how electricity passes through it, how the electrocardiograph (EKG) works to receive and record the electrical activity, and how this information is transmitted via telemetry to the appropriate receiving device.
Defined as the transmission of instrumental readings by various methods such as radio waves or wires, telemetry gathers and transmits EKG readings to a central or remote monitor for interpretation and storage (71). The ability to read EKG rhythms from a variety of monitors consists of more than looking at a rhythm strip and identifying the rhythm. It consists of knowing the anatomy of the heart, how electricity travels through it and translates into the EKG we know, and what changes can happen based on injury, electrolytes, or other causes.
Heart Anatomy 101
As we know, the heart consists of four chambers, two atria—right atria (RA) and left atria (LA)—and two ventricles—right ventricle (RV) and left ventricle (LV)—working in a cycle to ensure adequate blood flow occurs. The heart receives blood from the inferior and superior vena cava (IVC and SVC) and enters the RA, moves to the RV, passes through the pulmonary artery (PA) and lungs, returns to the LA, enters the LV, and exits the heart through the aorta.
Heart cells, known as myocytes, are negatively charged, or “polarized” at rest. When these muscle cells contract, they become “depolarized” or positively charged. But how do the myocytes know when to contract? Less than 1% of the cells in the heart have a special role and name. These are known as the pacemaker cells and their role is to ensure that the heart beats. This is done through the action potential that is spontaneously created by the pacemaker cells. Some of these pacemaker cells have different speeds in depolarization, meaning that the fastest pacemaker cells are the ones controlling the speed. This will make more sense later when discussing specific cardiac rhythms (69).
Starting in the right atria, the sinoatrial node (SA node) is the primary group of pacemaker cells that determines the heart rhythm. The SA node, as well as the other pacemaker cells within the heart, progress through a rapid depolarization and repolarization process (2).
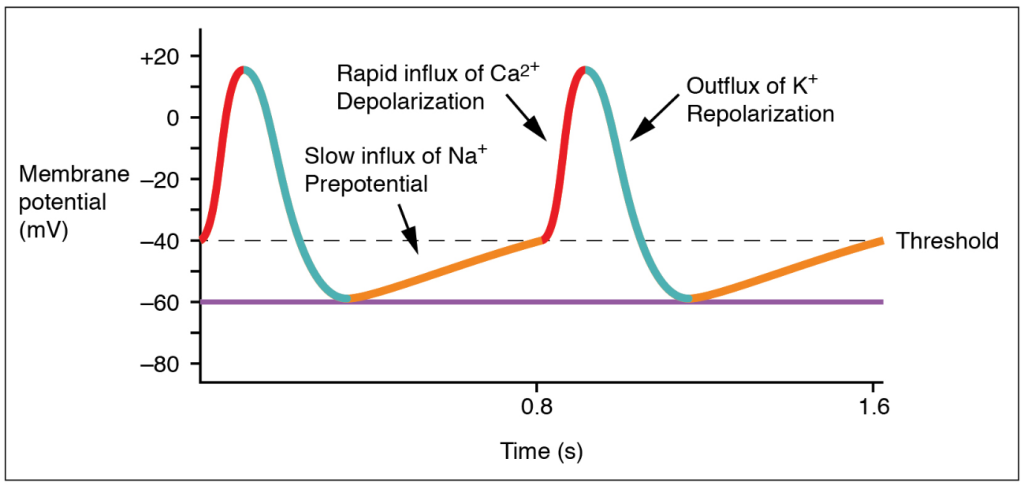
Pacemaker cells do not have a true resting potential, this means they are always in an “unstable” state to create spontaneous action potential. The action potential is the brief reversal of polarity in the cell; polarity consists of potassium (K+) in the cell with a negative charge, while sodium (Na+) and calcium (Ca++) are outside of the cell with a positive charge (2).
Starting at the beginning of the cardiac cycle the pacemaker cells always have a membrane potential or voltage—the voltage of the cellular membrane as a result of permeability and concentrations of ions inside and outside the cell—of -60 microvolts (mV). From -60mV to -50mV the channels within the cells open, leading to a slow influx of Na+ inside the cell and a slow depolarization of the cell. Once the membrane voltage has reached the minimum threshold of -50mV the Ca++ channels open, causing Ca++ to move into the cell. This is known as the rising depolarization phase. The membrane voltage reaches the peak and the next thing that happens is the falling repolarization phase. This is where the K+ channels open to return the cell to a repolarized state (2).
(20)
Once these steps have occurred, the energy is transferred to surrounding cells, and the cardiac cycle continues. However, the action potential in the other myocytes is slightly different. Myocytes have a resting potential, which is different from the pacemaker cells. The resting potential is around -90mV and these cells only start the depolarization process when stimulated by an external force. During the end of the pacemaker cell’s action potential phase, additional Ca++ is passed into the neighboring myocytes through gap junctions. The introduction of Ca++ into the cell causes a sharp rise in the membrane voltage that approaches the threshold which is -70mVs. Once that threshold has been reached, the NA+ fast channels open and a rapid depolarization occurs since Na+ is brought into the cell. The Ca++ slow channels open at -40mVs, further causing depolarization with Ca++ entering the cell (2).
At the peak of cellular depolarization, the Na+ channels close, leading to a slight repolarization through some K+ entering the cell. This is minor as the Ca++ channel is still open and continues to move K+ out of the cell. A plateau is created because of this and allows for the cell to go through two important phases. The first phase starts when the membrane voltage increases from the resting potential and continues until the plateau phase ends. This is known as the absolute refractory period and is where the myocytes relax before they can respond to additional stimuli. It prevents summation and tetanus which could lead to the heart not beating. The second phase is where additional Ca++ is pulled out of the sarcoplasmic reticulum (SR) to further push K+ out of the cell (2).
The phase ends when the Ca++ channel closes, extra Ca++ is sent back to the SR, and K+ is allowed back into the cell. The sodium/potassium pump allows Na+ to exit the cell, returning the cell to its resting potential. This rapid process occurs in every myocyte for the life of the cell. Pacemaker cells are the only cells that can generate a heartbeat. Impulses from the nervous system can increase or decrease the heart rate, but they are influencing the pacemaker cell to generate more beats, not creating them (2).
It is important to note that there are several sets of pacemaker cells within the heart. The SA node starts the process, but there are a few others spaced out along the electricity’s path to ensure that the atria and ventricles of the heart have time to fill and properly contract. The second set of pacemaker cells is the atrioventricular node (AV node) where a slight delay of 0.01-0.05 meters per second (m/s) happens to make sure that the ventricles fill up adequately. The bundle of His takes the electric impulse to the left and right bundle branches and from there, the Purkinje Fibers are triggered. These fibers have a speed of 2-4 m/s to provide enough force to eject the blood from the ventricles (69).
Correlating all of this back to telemetry, scientific development within the medical profession has allowed us to visualize this electrical activity and translate it into an effective method of diagnosing cardiac conditions such as abnormal heart rates or cell death.

Self Quiz
Ask yourself...
- Reflecting on what you know and what you have learned so far, what information would you consider important to know when it comes to reading EKGs or telemetry strips?
- What information, if any, was surprising to you in regard to the action potential of the pacemaker cells?
- Why do you think the pacemaker cells start with a voltage or an action potential?
Types of Telemetry
EKG
There are many ways to view cardiac rhythms now, however, the oldest method is the EKG. During the late 1700s, the Italian physician Luigi Galvani was experimenting with electricity and animal tissue. His experiments spanned at least three decades and inspired other physicians during and after his time. Using legs removed from the bodies of frogs, Galvani theorized that “animal electric fluid” enabled the muscles within the legs to move when touched by metals; according to him, this was “natural” fluid and not created as static electricity or friction is. He went on to theorize that the brain is an essential part of creating the “electric fluid” with nerves as the conductors (6).
Jumping forward to 1842, Doctor Carlo Matteucci made a significant contribution to EKGs. During his time researching electrical detection in animals, he discovered the electrical currents within the heart that accompany each heartbeat. Thirty-five years after Matteucci, Augustus Waller was able to use a capillary electrometer and electrodes to perform the first human EKG. These electrodes were placed on the chest and back of the participant and were vital in demonstrating there was electrical activity that preceded the contraction of the ventricles. William Bayliss and Edward Starling improved upon Waller’s research by using improved capillary electrometers to demonstrate triphasic cardiac electrical activity (1).
The Dutch physician most noted for creating the EKG known today was Doctor Willem Einthoven. He was inspired by Waller and those before him to improve the capillary electrometer, successfully identifying five deflections that were initially named ABCDE. Having to factor for inertia, Einthoven implemented mathematic correlation, resulting in the traditional EKG rhythm strips we use today with the letters PQRST depicted in the image below. Einthoven is also responsible for coining the word electrocardiogram or electrokardiogram in Dutch. This is where providers get the “k” in EKG from (1).
While Waller’s EKG utilized ten electrodes, Einthoven was able to condense that number to three, eliminating the right leg and the mouth electrodes. These three leads created Einthoven’s triangle; an important concept still used today and that will be discussed later. All of Einthoven's work resulted in him being awarded the Nobel Prize in Physiology and Medicine in 1924 (1).
Self Quiz
Ask yourself...
- What do you know of the history of the EKG and telemetry? Was there anything new you learned?
- What process of developing the EKG interested you the most? Why?
- Do you think there is more that can be done to improve EKG? If so, what do you think could be done?
Bedside Monitor
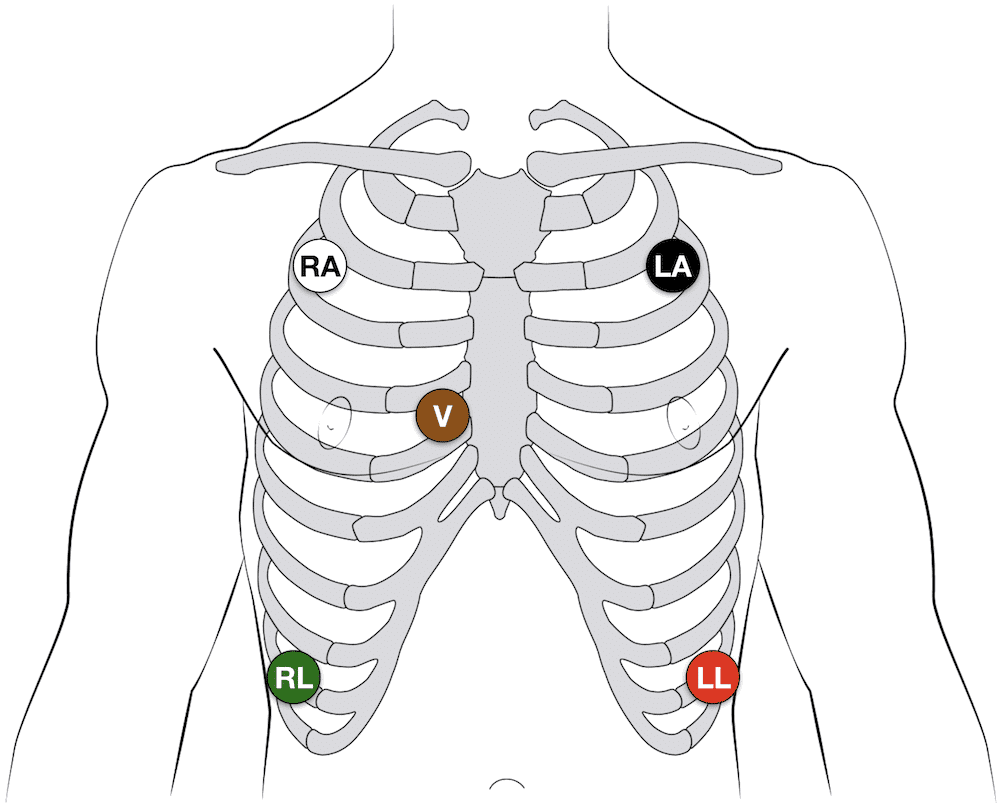
Emergency departments (ED), intensive care units (ICU), and other specialized areas that require continuous monitoring of a patient’s EKG and vital signs utilize various bedside monitors to ensure they are receiving accurate, real-time information on the patient. Cords are used to connect the patient to the monitor. The electrodes to display and document cardiac rhythm and heart rate are applied to patients in the standard 5 lead placement displayed in the below image. The vitals displayed on the monitor can also be displayed outside the room on a screen with multiple patients. Nurses, paramedics, or trained telemetry monitor technicians can watch many of these monitors at a time.
(14)
The placement of the five leads consists of the following:
- RA: 2nd intercostal space, anterior axillary on the right – some providers may put this lead higher on the chest or on the right arm
- LA: 2nd intercostal space, anterior axillary on the left – some providers may put this lead higher on the chest or on the left arm
- RL: 8th intercostal space, anterior axillary on the right – some providers may put this lead lower on the abdomen
- LL: 8th intercostal space, anterior axillary on the left – some providers may put this lead lower on the abdomen
- V: 4th intercostal space, right margin of the sternum
Note: Always follow the manufacturer’s instructions for specific lead placement.
Helpful Tip: Many healthcare providers quickly remember lead placement based on color is smoke (black) over fire (red) and snow (white) over grass (green). This leaves brown (chocolate) in the middle.
These bedside monitors can monitor pulse oximetry, respiratory rate, temperature, capnography, blood pressure, and arterial pressure. Some devices may have other unique monitoring features. These monitors may be portable or have a way to transfer the cords to a transport monitor. They come with alarms that can be adjusted based on the patient’s unique vital signs or hospital policy.
First responders have similar devices they use when transporting patients with the added benefit of having a defibrillator and a real-time feedback device built in (91).
Remote Monitoring
Remote cardiac monitoring is similar to bedside monitoring; however, the EKG rhythm, heart rate, and pulse oximetry are not displayed at the bedside. Instead, they are displayed in a different location, sometimes a monitor room, where a trained professional is watching many patients. When they recognize an abnormal rhythm, they will contact the appropriate staff to assess the patient. They may call for the leads to be removed, a change in rhythm, or a low battery.
The EKG leads are placed the same way as the bedside monitor leads are placed (always be sure to consult the manufacturer’s instructions). The information is transmitted wirelessly via wireless medical telemetry service (WMTS) from the “tele box,” but the leads must be wired to the box. WMTS does not use Wi-Fi and protects transmissions from Wi-Fi interference (48).
Mobile Cardiac Monitor and Event Monitor
A mobile cardiac or event monitor is a device attached to the skin that can perform continuous or event-specific monitoring. This device is attached to the patient’s chest near the heart and records when activated. This device is smaller than other portable cardiac monitoring devices like the Holter Monitor which will be discussed later. Information can be transmitted to the monitoring center to be reviewed by trained staff and/or artificial intelligence. Abnormalities like tachycardia, bradycardia, atrial fibrillation, or cardiac pauses are reported to a physician. The patient may or may not know about the rhythm abnormalities occurring as some patients are asymptomatic (18).
Event monitoring consists of the following methods (23):
- Patch monitor: depending on the manufacturer, the device is stuck to the chest and left on for a designated period of time.
- Loop memory monitor: the sensors always stay on the patient and the patient activates the devices to begin recording when symptoms occur in addition to a few minutes before the event starts and after it ends. There is an implanted option as well.
- Symptom event monitor: Patients place the monitor on them and activate it like a patch monitor, but only when symptoms start.
Insertable Monitor
Insertable or implantable cardiac monitors are just like mobile and event monitors, but they are surgically inserted into the patient. They perform the same actions, but there is an added benefit to these devices. If the patient has worn an external device in the past and has known cardiac arrhythmias, they may have an implanted cardioverter-defibrillator (ICD) inserted to detect and treat the abnormal rhythm. These devices are connected to the heart via wires (they may be placed in the right atria, the right ventricle, or both) and are operated by batteries that do need to be changed per manufacture direction. Patients and providers should be aware of magnets, or electrical signals from other devices that can interfere with the insertable device (61).
Healthcare providers can “interrogate” ICDs or pacemakers with a device created by the monitor’s manufacturer. When interrogated, the device’s information is transmitted to a monitor center who calls the provider to give them a verbal report of what the device has recorded; a paper copy is often faxed to the provider as well. Some newer interrogation devices may display the information of the device on the screen.
Holter Monitor
As mentioned with mobile cardiac monitors, the Holter monitor is another wearable device that can be used to monitor and diagnose cardiac arrhythmias outside of the hospital setting. This device consists of five electrodes and a monitor that the patient can wear or carry on them. It is similar to the remote telemetry devices used in the inpatient hospital setting as shown in the next image. Patients wear this device for a short time, and information is not transmitted to a monitor technician. Instead, information collected is sent to a monitoring center where it is interpreted and sent to the physician (58).
As covered in this section, there are many options for cardiac telemetry monitoring, and providers may encounter many types of them. It is important to know these devices and how they operate.
Self Quiz
Ask yourself...
- What types of telemetry/EKGs are you most familiar with? Which ones would you like to know more about?
- Are there any parts of the devices mentioned above that you have never heard of before?
- Out of all the devices which one do you like best? Which device do you not like?
- What devices do you think could be improved and how would you suggest improving them?
Lead Placement
Now that we have discussed the types of telemetry monitoring devices that are available, it is time to discuss how to properly place the EKG leads on a 12 lead, 15 lead, right-sided EKG, and where to place the V4R lead.
12 Lead EKG
For the 12 lead EKG, providers should start with the four limb leads (14):
- RA: On the upper or lower right arm
- LA: On the upper or lower left arm
- RL: on the upper or lower right leg
- LL: on the upper or lower left leg
From there, the six pericardial leads are placed strategically around the chest to create a partial circle around the heart (14):
- V1: 4th intercostal space, right margin of the sternum (this is lead V on the 5 lead EKG)
- V2: 4th intercostal space, left margin of the sternum
- V3: sits midway between leads V2 and V4 on the left
- V4: 5th intercostal space, mid-clavicular line on the left
- V5: 5th intercostal space, anterior axillary line on the left (aligned horizontally with V4, between V4 and V6) on the left
- V6: 5th intercostal space, mid-axillary line on the left (aligned horizontally with V4)
15 Lead EKG
The 15 lead EKG uses the same leads as the 12 lead EKG, but it adds V7, V8, and V9, known as the posterior leads, to encompass the posterior angles of the heart (14):
- V7: left posterior axillary line (aligned horizontally with V6, across from V5)
- V8: tip of the left scapula (aligned horizontally with V6, across from V4)
- V9: left of the spinal column (aligned horizontally with V6, across from V3)
Right Sided EKG
The right-sided EKG is important to rule out the diagnosis of a right-sided myocardial infarction (MI) or ischemia in or out while treating a patient. Lead placement is the same for the four limb leads, but the 6 precordial leads are flipped (14):
- V1: 4th intercostal space, left margin of the sternum
- V2: 4th intercostal space, right margin of the sternum (this is lead V on the 5 lead EKG)
- V3: sits midway between leads V2 and V4
- V4: 5th intercostal space, mid-clavicular line on the right
- V5: 5th intercostal space, anterior axillary line on the right (aligned horizontally with V4, between V4 and V6)
- V6: 5th intercostal space, mid-axillary line on the right (aligned horizontally with V4)
V4R Lead Placement
A full right-sided EKG is not always needed. Lead V4 on the right side of the heart is the most important lead when it comes to determining an MI on the right side of the heart (14):
- V1, V2, V3, V5, V6: same placement as the 12 and 15 lead EKGs.
- V4 is removed and placed on the right side of the chest
- V4R: 5th intercostal space, mid-clavicular line on the right (Where it is located on a complete right sided EKG)
- The “R” stands for right to ensure that those reading the EKG are aware that lead is on the right while the rest are located on the left side of the chest.
Limb Leads
Now that lead placement has been covered, we can now discuss how lead placement shows different parts of the heart.
Leads I, II, III, AVR, AVL, and AVF are considered limb leads when reading the EKG. It is important to note that the right leg lead is the grounding electrode and does not affect the EKG (83). Leads I, II, and III leads form a triangle over the chest known as Einthoven’s Triangle as reflected in the below image. Lead I always has negative polarity while lead III always has positive polarity. Lead II’s polarity depends on what side of the triangle is being discussed. If we are looking at lead I on the EKG, then lead II is positive, but if we are looking at lead III, then lead II is negative (82).
The importance of what leads are negative and positive comes from how electricity travels through the heart. It starts on the right side and moves to the left, so it would make sense for lead I to have negative polarity while leads II and III are positively charged (82). This is also why the height of a PQRST complex changes based on what lead is being looked at on an EKG as reflected below.
Augmented or unipolar leads AVR, AVL, and AVF have the heart as the negative electrode and the limb leads are the positive electrodes. AVR goes from the heart to the right arm lead, AVL goes from the heart to the left arm lead, and AVF goes from the heart to the left leg lead. Just as discussed with leads I, II, and III, the path of the electricity in the heart determines how the PQRST complex appears on the rhythm strip (82). Lead II is the preferred strip to read by providers due to the best view of the rhythm due to the way electricity travels through the heart and how lead II follows that path by starting at the right shoulder and going to the left leg.
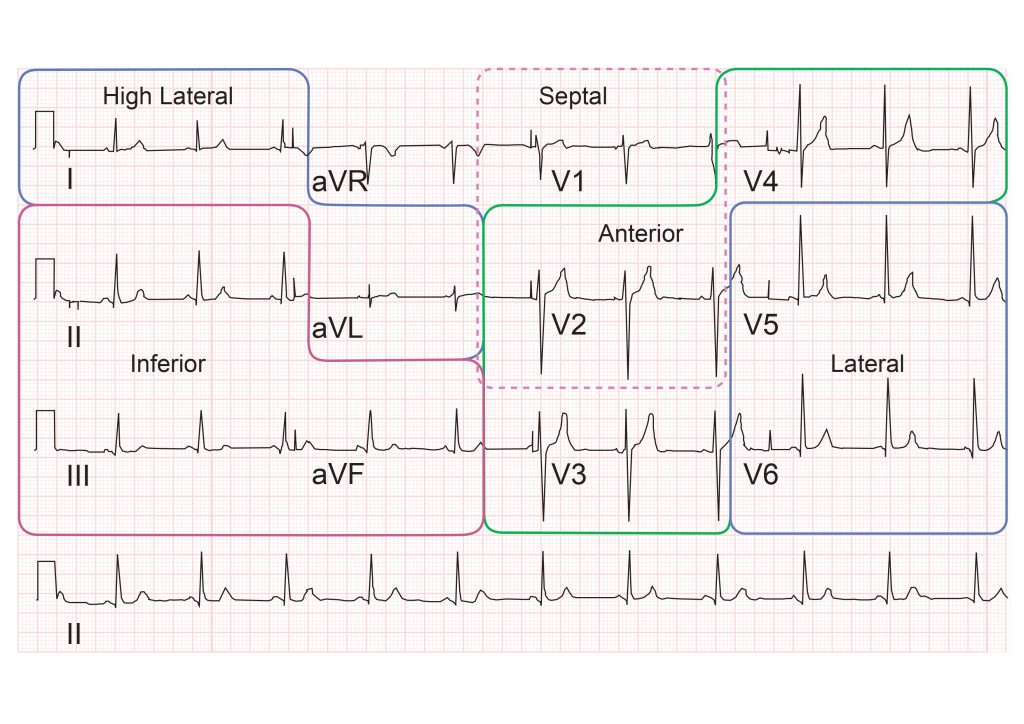
The chest leads, V1 – V9, create a circle around the heart on a horizontal plane. These leads are unipolar as well, with the heart being the negative electrode. Multiple views of the heart are captured because of the many leads placed along the patient’s body. This can give providers valuable knowledge on what areas of the heart may be affected. The next image gives a visual depiction of how the leads display their view of the heart.
Self Quiz
Ask yourself...
- What lead do you think is the most beneficial in reading EKGs? Why do you think that?
- What lead do you prefer to use when reading EKGs? What makes that your “go-to” lead?
- If you could make a policy on EKGs, would you include what type of EKG should be done on patients? Would all patients with chest pain get a 15 lead EKG instead of 12?
- Do you think that one type of EKG is better than the other? Or do they all have their specific uses and benefits?
Reading EKGs: EKG Components
To be able to interpret EKGs successfully, nurses must first have knowledge about the EKG components displayed on the EKG strips and how each part correlates to a part of a single heartbeat.
P wave
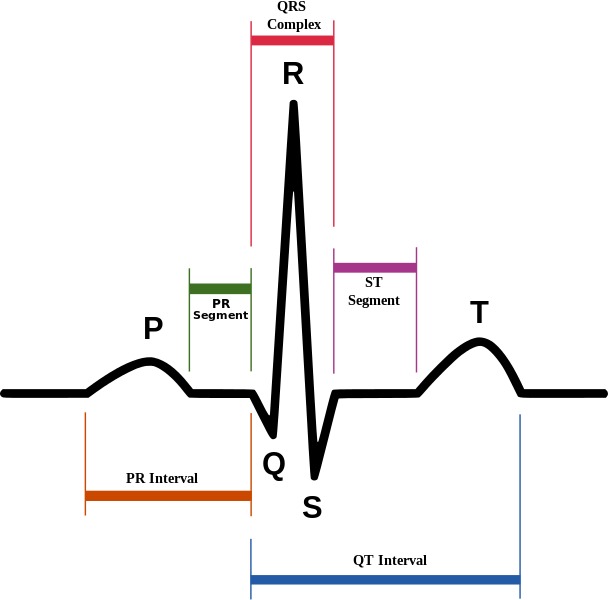
The P wave is the first deflection from the isoelectric line or baseline. Correlating this to the heart, this is where the atria depolarize or contract. The contraction of the right atria starts at the beginning of the P wave while the contraction of the left atria begins in the middle and end of it. Normal P waves are apparent between 120 and 200 milliseconds (msec) before the upward deflection of the QRS complex (44)
PR Interval
The next part of the PQRST complex is the PR interval. The interval symbolized the time between the depolarization of the atria and the depolarization of the ventricle. The normal speed is 120 to 200 msec (44).
PR Segment
Next is the PR segment. This is similar to the PR interval but starts at the end of the P wave and ends at the start of the Q wave. This line is important because if there is a deviation from the isoelectric line, it could indicate a cardiac rhythm abnormality like Wolff-Parkinson-White syndrome which will be discussed later. The EKG may have a “slurred” upstroke from the P to R points on the EKG, making the Q wave appear to be on the isoelectric line. This is because the ventricles were stimulated or excited early, leading to a shortened PR interval. The “slurred” area is known as a delta wave (13).
QRS Complex
The QRS complex is where the ventricles depolarize and contract. The first downward deflection of the beat is the Q wave that lasts for < 0.05 seconds. It is present in all leads save for V1 and V3 due to the angle of the vector. The R wave is the upward deflection of the complex. R waves do not have a set height, but severely elevated R waves can be an indicator of ventricular hypertrophy. The second downward deflection is the S wave. Overall, the QRS complex is 0.07 to 0.10 seconds long and variations to this time can be an indicator of abnormal heart rhythms (17).
ST Segment
The ST segment starts when the S wave ends by returning to the isoelectric line and ends when the T wave begins. This period represented the completion of ventricular depolarization (17). The ST segment lasts 0.08 seconds to 0.12 seconds (51).
T Wave
The final wave in the standard EKG components is the T wave. This wave symbolizes the ventricles repolarizing. Inverted T waves can be an indication of past or current infections. A peaked T wave—as opposed to the normal curved T wave—can be caused by hypocalcemia, hyperkalemia, and left ventricular hypertrophy (17). The T wave runs from 0.01 seconds to 0.25 seconds (51).
The image below depicts the components of an EKG with labels to assist with understanding how the waves appear.
(4)
Reading EKGs: EKG Paper
The EKG paper has sets of squares, 25 little squares within one larger square. The smaller squares symbolize 0.04 seconds making the larger square 0.20 seconds. A single small square is 1mm while the large square is 5mm, this is because the larger square is five small squares tall.

(15)
Some EKG strips are presented in a six second format. To determine if the strip is a six-second, you must count the larger boxes. 30 larger boxes are required for the strip to be six seconds. Some may even have second markers that symbolize one second of time passed.
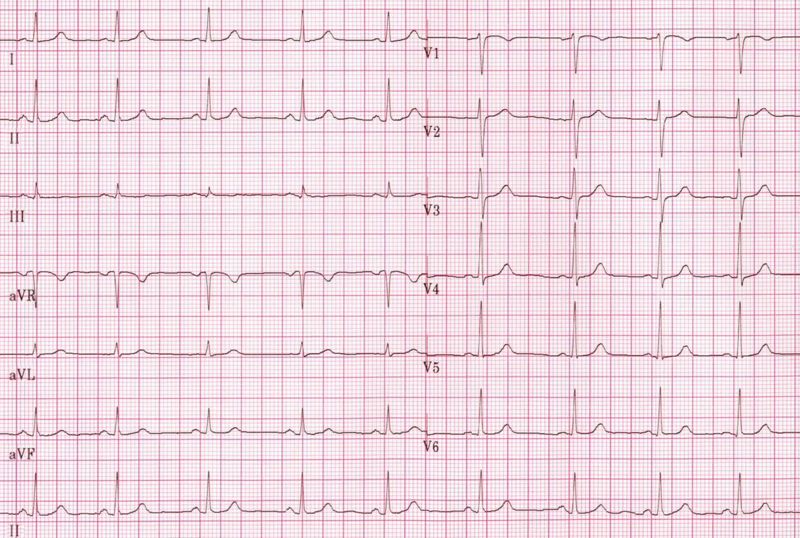
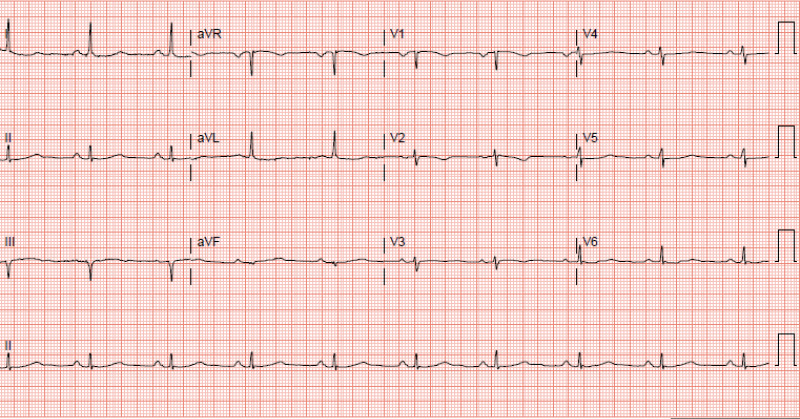
The 12 lead EKG can be more challenging to read and is often used to make an overall observation about the patient’s heart rate and rhythm. It can provide more information to providers than a single lead strip can.
As discussed previously, the leads are placed along the path of the heart, and providers can determine what part of the heart may be affected by knowing what leads are placed where.
| Lead | Location |
| II, III, AVF | Inferior |
| I, AVL, V5, V6 | Lateral |
| V2, V3, V4 | Anterior |
| V1, AVR | Right atrium, left ventricle |
(51)
Now that we have discussed leads, lead placement, the PQRST complex, and EKG paper, it is time to cover different cardiac rhythms that you may encounter.
Self Quiz
Ask yourself...
- What parts of the PQRST complex may not appear on the EKG strip?
- How do you remember what leads are associated with each part of the heart?
- What are some ways you can quickly determine heart rate using an EKG strip?
- Is there a part of the PQRST complex do you think is important to pay attention to? Why do you think that?
Rhythm Recognition
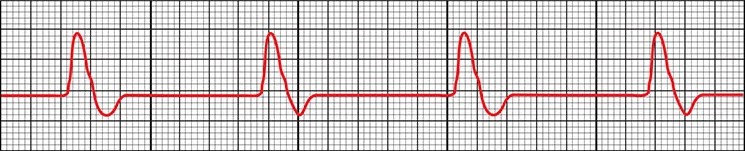
Normal Sinus (41):
- Rate: 60-100 beats per minute (bpm)
- Conduction:
- PR interval 120-200ms
- QRS width 60-100ms
- P wave morphology:
- The maximum height of the P wave is:
- Lead II and III: 2.5 mm
- The P wave is:
- Positive or above the isoelectric line in II and AVF
- Biphasic (curves above and then dips below the isoelectric line) in V1
- Duration:
- Less than 0.12 seconds
- Rhythm Strip:
- The maximum height of the P wave is:
(29)
Sinus Bradycardia (87):
- Rate: less than 60bpm
- Conduction:
- PR interval 120-200ms
- QRS width 60-100ms
- P wave morphology:
- The maximum height of the P wave is:
- Lead II and III: 2.5 mm
- The P wave is:
- Positive or above the isoelectric line in II and AVF
- Biphasic in V1
- Rhythm Strip:
- The maximum height of the P wave is:
(87)
- Signs and Symptoms:
- None – depending on the patient
- Cyanosis
- Peripheral edema
- Shortness of breath
- Dizziness
- Fatigue
- Syncope or near syncope
- Lightheadedness
- Causes (not limited to):
- Normal physiology in an athlete
- Medications like beta-blockers
- Ischemia
- Heart diseases
- Sick sinus syndrome
- Hypothermia
- Hypothyroidism
- Neuro-mediated bradycardia as caused by a vasovagal reaction
- Pericarditis
- Hypoxia
- Electrolyte imbalances
- Treatment:
- None if asymptomatic, admission for observation may be indicated
- Medications:
- Atropine 0.5mg every 3 to 5 minutes for a maximum dose of 3mg
- Antidotes or reversal agents
- Transcutaneous cardiac pacing or pacemaker
- Return patient to a normothermic state if hypothermic
Sinus Tachycardia (55):
- Rate: greater than 100bpm but less than 150bpm
- Conduction:
- PR interval 120-200ms
- QRS width 60-100ms
- P wave morphology:
- The maximum height of the P wave is:
- Lead II and III: 2.5 mm
- The P wave is:
- Positive or above the isoelectric line in II and AVF
- Biphasic in V1
- Rhythm Strip:
- The maximum height of the P wave is:
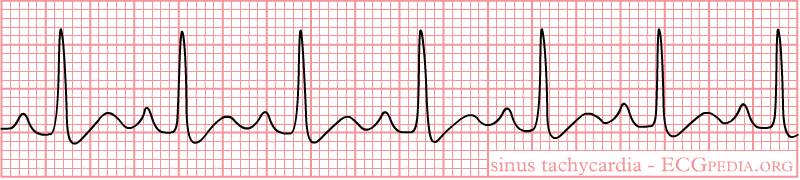
(42)
- Signs and Symptoms:
- Shortness of breath
- Chest pain
- Dizziness
- Syncope or near syncope
- Lightheadedness
- Palpitations
- Causes:
- Infection or sepsis
- Medications
- Withdrawal
- Electrolyte imbalances
- Blood loss or anemia
- Dehydration
- Hypoglycemia
- Pulmonary embolism
- Trauma
- Cardiac tamponade
- Myocarditis
- Pregnancy
- Treatment:
- Medications
- Antibiotics
- Antidotes or reversal agents
- Insulin
- Electrolyte replacement
- Fluids
- Heparin or other anticoagulant medications
- Blood replacement
- Surgery
- Medications
Self Quiz
Ask yourself...
- Looking at the signs and symptoms for sinus bradycardia what other signs and symptoms have you seen with patients who present with that heart rhythm?
- What other causes have you seen as the reason for sinus bradycardia?
- With sinus tachycardia, when would you be concerned with the causes of the rhythm?
- Are there any other treatments you could think of for either sinus bradycardia or tachycardia?
1st Degree AV Block (68):
- Rate: 60-100 beats per minute (bpm)
- Conduction:
- PR interval greater than 0.20 seconds
- P wave morphology:
- The maximum height of the P wave is:
- Lead II and III: 2.5 mm
- The P wave is:
- Positive or above the isoelectric line in II and AVF
- Biphasic in V1
- A QRS complex always follows the P wave
- The maximum height of the P wave is:
- Duration:
- Less than 0.12 seconds
- Rhythm Strip:
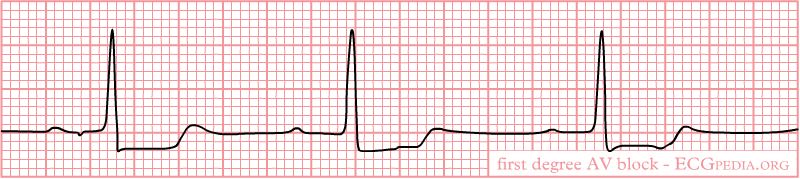
(32)
- Signs and Symptoms:
- None
- Fatigue
- Shortness of breath
- Syncope or near syncope
- Chest pain
- Lightheadedness
- Causes:
- Increased vagal tones in young patients
- Fibrotic changes in the elderly
- Cardiac disease
- Inflammation
- Medications
- Electrolyte abnormalities
- Treatment:
- None if asymptomatic
- Medications
- Antibiotics
- Antidotes or reversal agents
- Electrolyte replacement
2nd Degree Type I AV Block (Mobitz Type 1 or Wenckebach) (60):
- Rate: varies
- Conduction:
- PR interval increases with each beat, eventually “dropping off” and another P wave appears
- “Longer, longer, drop, that’s a Wenckebach.”
- P wave morphology:
- The maximum height of the P wave is:
- Lead II and III: 2.5 mm
- The P wave is:
- Positive or above the isoelectric line in II and AVF
- Biphasic in V1
- Rhythm Strip:
- The maximum height of the P wave is:

(27)
- Signs and Symptoms:
- None
- Fatigue
- Shortness of breath
- Syncope or near syncope
- Chest pain
- Lightheadedness
- Causes:
- Increased vagal tones
- Cardiomyopathy
- Myocardial infarction
- Cardiac surgery
- Electrolyte abnormalities
- Medications
- Treatment:
- None if asymptomatic
- Medications
- Atropine if bradycardic
- Antidotes or reversal agents
- Electrolyte replacement
2nd Degree Type II AV Block (Mobitz II) (60):
- Rate: varies
- Conduction:
- PR interval varies
- QRS width 60-100ms when present
- QRS does not follow all P waves
- P wave morphology:
- The maximum height of the P wave is:
- Lead II and III: 2.5 mm
- The P wave is:
- Positive or above the isoelectric line in II and AVF
- Biphasic in V1
- Rhythm Strip:
- The maximum height of the P wave is:
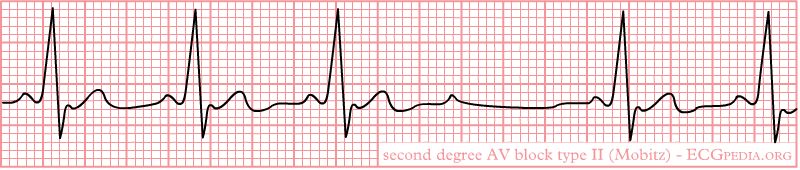
(40)
- Signs and Symptoms:
- Fatigue
- Shortness of breath
- Syncope or near syncope
- Chest pain
- Lightheadedness
- Cardiac arrest
- Causes:
- Structural heart disease
- Amyloidosis
- lymphoma
- Cardiac tumors
- Transcatheter placement of valves
- Myocardial infarction
- Genetics
- Treatment:
- None if asymptomatic
- Medications
- Atropine does not work on these patients
- Antidotes or reversal agents
- Transcutaneous cardiac pacing or pacemaker since this rhythm can progress to a complete heart block or cardiac arrest
3rd Degree AV Block (78):
- Rate: varies, but usually bradycardic
- Conduction:
- PR interval varies
- QRS width 60-100ms when present
- P wave and QRS complex do not communicate (called AV disassociation)
- P wave morphology:
- The maximum height of the P wave is:
- Lead II and III: 2.5 mm
- The P wave is:
- Positive or above the isoelectric line in II and AVF
- Biphasic in V1
- Rhythm Strip:
- The maximum height of the P wave is:

(33)
- Signs and Symptoms:
- Fatigue
- Shortness of breath
- Syncope or near syncope
- Chest pain
- Lightheadedness
- Hemodynamic instability
- Cardiac murmurs
- Cardiac arrest
- Causes:
- Cardiac surgery
- Cardiac disease
- Medications
- Electrolyte imbalances
- Lyme disease
- Transcatheter aortic valve replacement
- Myocardial infarction
- Systemic lupus erythematosus
- Sarcoidosis
- Treatment:
- Medications
- Atropine usually does not work, but can be administered
- Epinephrine
- Dopamine
- Antidotes or reversal agents
- Electrolyte replacement
- Transcutaneous cardiac pacing or pacemaker
- Medications
Self Quiz
Ask yourself...
- 2nd degree Type I and Type II can be mixed up, what are your methods for remembering how each one appears on the EKG strip?
- What type of AV block would lead you to provide quick intervention and why?
- Have you encountered a patient with any of these rhythms? What was the cause? How was it resolved, if it was?
- Are there any causes for these rhythms that were not listed?
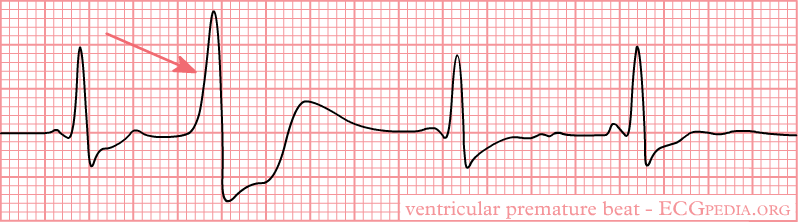
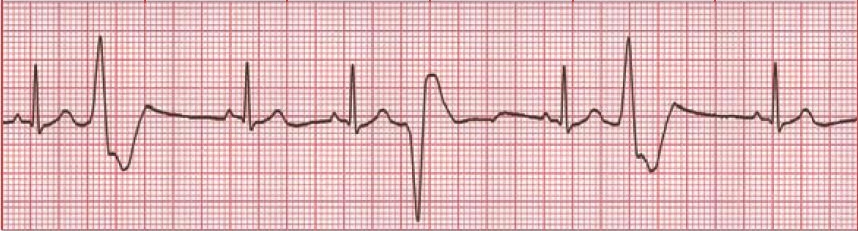
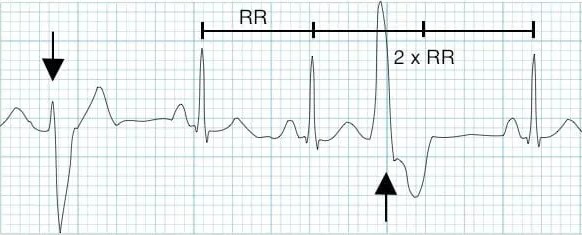
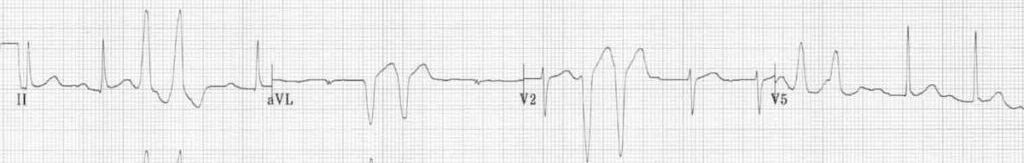
Premature Ventricular Contraction (PVC) (88):
- Rate: varies, underlying rhythm is usually normal sinus
- The impulse to beat comes from the ventricles, not from the SA node
- Conduction:
- PR interval varies, but in a regular PQRST complex PR interval is 120-200ms
- PR interval after a PVC is longer due to the PVC and the retrograde concealed conduction goes back into the AV node junction.
- PVC QRS width is at least 120ms but usually 160-200ms
- Regular QRS width is 60-100ms
- PR interval after a PVC is longer due to the PVC and the retrograde concealed conduction goes back into the AV node junction.
- P wave morphology:
- The maximum height of the P wave is:
- Lead II and III: 2.5 mm
- The P wave is:
- Positive or above the isoelectric line in II and AVF
- Biphasic in V1
- Rhythm Strip:
- Monomorphic: All PVCs are shaped the same
- The maximum height of the P wave is:
(38)
- Biomorphic: PVCs are shaped differently
(64)
- Bigeminy: Every PVC is separated by one sinus beat.

(35)
- Trigeminy: Every PVC is separated by two sinus beats.
(9)
- Ventricular Couplet: Two PVC beats in a row.
(9)
- Ventricular Triplet: Three PVC beats in a row.

(9)
- Signs and Symptoms:
- None
- Fatigue
- Shortness of breath
- Syncope or near syncope
- Chest pain
- Palpitations
- Lightheadedness
- Abnormal neck pulsation
- Hemodynamic instability with frequent PVCs
- Cardiac arrest
- Causes:
- Hypoxia
- Illicit drug use
- Amphetamines
- Alcohol
- Cocaine
- Electrolyte imbalances
- Myocarditis
- Mitral valve prolapse
- Hypercarbia
- Cardiomyopathies
- Myocardial infarction
- Medications
- Treatment:
- None if asymptomatic
- Medications
- Beta-blockers
- Calcium channel blockers
- Amiodarone is for those with preexisting coronary artery diseases, but used with caution and close observation and monitoring
- Antidotes or reversal agents
- Electrolyte replacement
- Cardiac ablation
- Defibrillation if cardiac arrest occurs
Premature Atrial Contractions (PAC) (54):
- Rate: varies, underlying rhythm is usually normal sinus
- Conduction:
- PR interval varies, but in a regular PQRST complex PR interval is 120-200ms
- PAC
- Regular QRS width is 60-100ms
- P wave morphology:
- The maximum height of the P wave is:
- Lead II and III: 2.5 mm
- The P wave:
- Can be inverted
- May be hidden in the T wave creating a hump or peaked T wave
- These rhythms can come in the same variations as PVCs:
- Bigeminy
- Trigeminy
- Couplet
- Triplet
- Rhythm Strip:
- The maximum height of the P wave is:
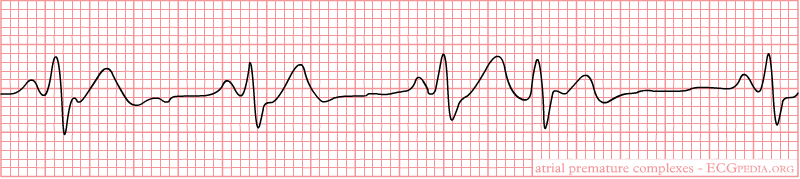
(37)
- Signs and Symptoms:
- None
- Palpitations
- Shortness of breath
- Anxiety
- Signs and symptoms of heart failure
- Early or additional heart sounds
- Pauses in rhythm
- Causes:
- Coronary artery disease
- Left ventricular hypertrophy
- Septal defects
- Congenital heart deformities
- Medications
- Beta-blockers
- Chemotherapeutic agents
- Congestive heart failure
- Diabetes mellitus
- Hypertension
- Chronic obstructive pulmonary disorder
- Anxiety
- Treatment:
- None if asymptomatic
- Avoiding triggers
- Medications
- Beta-adrenergic blockers
- Antiarrhythmic agents are used with caution and close observation and monitoring
- Antidotes or reversal agents
- Cardiac ablation
Self Quiz
Ask yourself...
- Between PACs and PVCs, which one would you be more concerned about? Why did you pick that rhythm?
- Have you encountered a patient with either of these rhythms? What treatments were ordered if any?
Ventricular Tachycardia (V Tach) (45):
- Rate: greater than 100bpm
- Conduction:
- PR interval none
- QRS width greater than 140ms
- P wave morphology:
- Not present
- Non-sustained V-Tach: three or more ventricular beats over a maximum of 30 seconds.
- Sustained V-Tach: a run of V Tach for more than 30 seconds or less is treated by cardioversion
- Monomorphic V-Tach: all ventricular beats look the same
- Polymorphic V-Tach: the ventricular beats look different.
- Biphasic V Teach: where the QRS complexes alternate with each beat.
- Digoxin intoxication
- Long QT syndrome
- Rhythm Strip:
- Monomorphic V-Tach
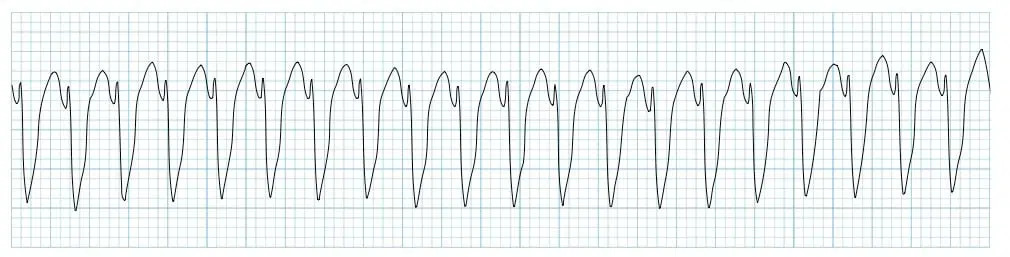
(11)
- Signs and Symptoms:
- Palpitations
- Shortness of breath
- Chest pain
- Syncope or near syncope
- Signs of heart failure
- Hemodynamic instability
- ICD shocks if the patient has one
- Cardiac arrest
- Also known as pulseless V-Tach
- Causes:
- Ischemic heart disease
- Acute coronary artery disease
- Myocardial scar-related reentry
- Congenital heart deformities
- Cardiomyopathy
- Illicit drugs
- Cocaine
- Digitalis toxicity
- Methamphetamine
- Medications
- Beta-blockers
- Chemotherapeutic agents
- Electrolyte imbalances
- Sepsis
- Metabolic acidosis
- Inherited cardiac channelopathies
- Treatment:
- Cardiopulmonary resuscitation (CPR) and defibrillation if no pulse present
- Cardioversion if hemodynamically unstable and has a pulse
- Treatment for myocardial infarction
- Medications
- Amiodarone, procainamide, sotalol
- Antidotes or reversal agents
- ICD
- Cardiac ablation
Self Quiz
Ask yourself...
- What would be the priorities when providing care to a patient with V-Tach with a pulse?
- If you were the only one in the room with the patient what would be your first action?
- Have you ever cardioverted a patient with this rhythm? What do you remember from the event?
- Do you think the patient should sign consent before cardioversion? Why or why not?
Torsades de Pointes (V Fib) (25):
- Rate: none
- Conduction:
- Polymorphic V-Tach with a prolonged QR interval
- P wave morphology:
- Not present
- Rhythm Strip:
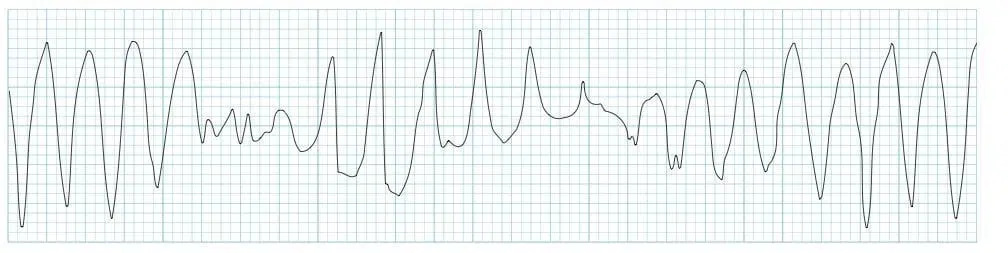
(12)
- Signs and Symptoms:
- None
- Syncope or near syncope
- Dizziness
- Lightheadedness
- Hypotension
- Rapid pulse
- Cardiac arrest
- No pulse
- Not breathing or only gasping for air
- Loss of consciousness
- Causes:
- Electrolyte imbalances
- Medications
- Zofran causes a long QT interval (19)
- Congenital prolonged QT:
- Jervell and Lange-Nielsen
- Romano-Ward syndrome
- Bradycardia
- Diuretic use
- Female gender
- Age
- Treatment:
- Electrolyte replacement
- CPR and defibrillation
- Medications
- Epinephrine
- Atropine
- Cardioversion
- Treatment of the underlying cause
Supraventricular Tachycardia (SVT) (72):
- Rate: Greater than 160bpm
- Conduction:
- PR interval not present
- QRS width less than 120 milliseconds = narrow complex, regular SVT
- QRS width greater than 120 milliseconds = wide complex, regular SVT
- P wave morphology:
- Not present
- Rhythm Strip:
- Narrow complex, regular SVT
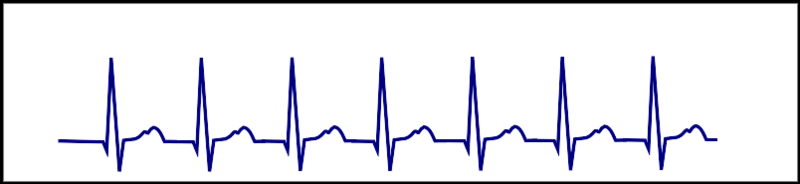
(30)
- Wide complex, regular SVT

(79)
- Signs and Symptoms:
- None
- Hypotension
- Shortness of breath
- Lightheadedness
- Signs and symptoms of heart failure
- Shock
- Causes:
- Narrow complex, regular SVT - Orthodromic reentry phenomenon (56):
- Accessory pathway that connects the atria and ventricles without passing through the AV node
- A pulse goes through the AV node, down into the ventricles via the Bundle of His, up through the accessory pathway, and back into the AV node
- Wide complex, regular SVT - Atrioventricular reentry phenomenon (57):
- Signals from the SA node travel through the accessory pathway down the ventricles via the Bundle of His and up to the AV node, creating a backward cycle.
- This is slower than the orthodromic SVT because it is traveling against the regular path of conduction, leaving to a wide QRS complex
- Medications
- Caffeine
- Smoking
- Stress
- Alcohol
- Narrow complex, regular SVT - Orthodromic reentry phenomenon (56):
- Treatment:
- None if asymptomatic
- Vagal maneuvers
- Bearing down
- Blowing into a straw
- Medications
- Adenosine: 1st dose 6mg, 2nd dose 12mg
- Ensure rapid saline flush after pushing medication as it has an extremely short half-life
- Cardizem
- Antidotes or reversal agents
- Adenosine: 1st dose 6mg, 2nd dose 12mg
- Cardioversion
- Cardiac ablation
Self Quiz
Ask yourself...
- If you have encountered a patient in SVT, what vagal maneuvers have you seen used? Were they successful or not?
- If you have not encountered a patient with SVT, what vagal maneuvers could you think of that might be utilized?
- Would a patient’s age impact the vagal maneuvers used? Why or why not?
- Do you know the half-life of Adenosine? If not, will you look it up after this course?
Ventricular Fibrillation (V-Fib) (3):
- Rate: none
- Conduction:
- PR interval not present
- QRS width not present
- P wave morphology:
- Not present
- Rhythm Strip:
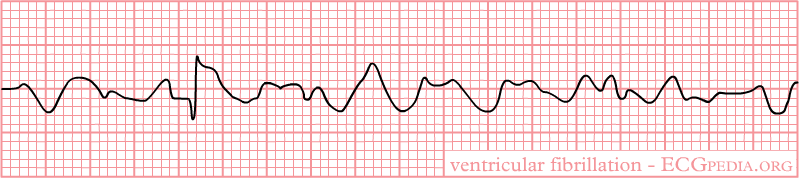
(39)
- Signs and Symptoms:
- Cardiac arrest
- No pulse
- Not breathing or only gasping for air
- Loss of consciousness
- Causes:
- Electrolyte imbalances
- Myocardial infarction
- Congenital heart defects
- Sudden blow to the chest right over the heart
- Medications
- Anemia
- Cardiomyopathy
- Electrocution
- Thoracic trauma
- Heart surgery
- Treatment:
- CPR and defibrillation
- Medications
- Epinephrine
- Atropine
- Electrolytes
- Surgery
- Coronary perfusion
- Treatment of the underlying cause
- Cardiac arrest
Asystole (59):
- Rate: none
- Conduction:
- PR interval not present
- QRS width not present
- P wave morphology:
- May or may not be present
- Rhythm Strip:

(21)
- Signs and Symptoms:
- Cardiac arrest
- No pulse
- Not breathing or only gasping for air
- Loss of consciousness
- Causes:
- Electrolyte imbalances
- Myocardial infarction
- Congenital heart defects
- Medications or illicit drugs
- Blood loss
- Cardiomyopathy
- Electrocution
- Trauma
- Treatment:
- CPR
- Since there is no electrical activity with this rhythm, defibrillation cannot be used
- Medications
- Epinephrine
- Atropine
- Electrolytes
- Surgery
- Coronary perfusion
- Treatment of the underlying cause
- CPR
- Cardiac arrest
Pulseless Electrical Activity (PEA) (22):
- Rate: varies
- There is no pulse with this rhythm despite the fact that it may appear as an organized rhythm
- Conduction:
- PR interval none
- QRS width greater than 110ms
- P wave morphology:
- Not present
- The P wave is:
- Not present
- Rhythm Strip:
(22)
- Signs and Symptoms:
- Cardiac arrest
- No pulse
- Not breathing or only gasping for air
- Loss of consciousness
- Causes:
- Electrolyte imbalances
- Myocardial infarction
- Congenital heart defects
- Medications or illicit drugs
- Blood loss
- Cardiomyopathy
- Electrocution
- Trauma
- Hypothermia
- Pneumothorax or hemothorax
- Treatment:
- CPR
- Since there is no electrical activity with this rhythm, defibrillation cannot be used
- Medications
- Epinephrine
- Atropine
- Electrolytes
- Surgery
- Coronary perfusion
- Treatment of the underlying cause
- CPR
- Cardiac arrest
Self Quiz
Ask yourself...
- What are some misconceptions about V-Fib, asystole, and PEA?
- How do you educate other staff members and family members on these misconceptions?
- What treatments have you seen work on V Fib? What treatments did not work?
- Have you ever seen a patient’s rhythm change from asystole to another rhythm?
- What is the most prominent cause of cardiac arrest in your area?
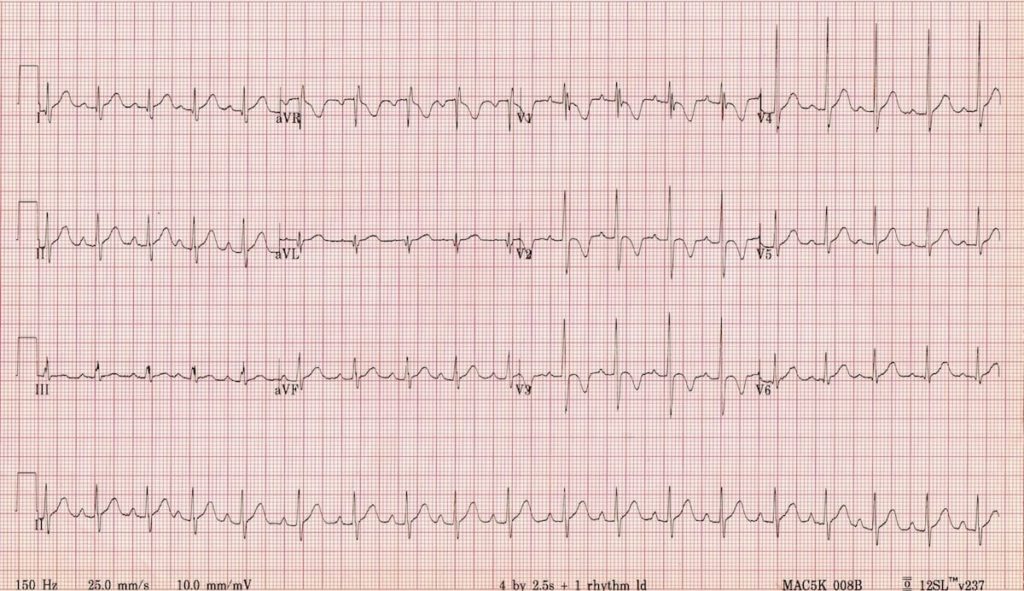
Atrial Flutter (73):
- Rate: varies
- Depends on how many QRS complexes there are
- Atrial rate 250-350 bpm
- Ventricular rate 75-150bpm
- P waves can come in blocks
- 2 P waves per 1 QRS (2:1)
- 3 P waves per 1 QRS (3:1)
- 4 P waves per 1 QRS (4:1)
- Intervals of P waves per 1 QRS (2:1 then 3: 1 then 2:1 then 4:1)
- Conduction:
- PR interval varies
- QRS width 60-100ms
- P wave morphology:
- The maximum height of the P wave is:
- Lead II and III: 2.5 mm
- Sawtooth pattern
- Rhythm Strip:
- The maximum height of the P wave is:
- Depends on how many QRS complexes there are
(31)
- Signs and Symptoms:
- None
- Palpitations
- Fatigue
- Syncope or near syncope
- Shortness of breath
- Regular or irregularly regular pulse
- Causes:
- COPD
- Heart failure
- Atrial size abnormalities
- Hypertension
- Diabetes mellitus
- Age
- Male gender
- Treatment:
- None if asymptomatic
- Medications
- Amiodarone
- Cardizem
- Metoprolol
- Anticoagulation to prevent stroke
- Catheter ablation
- Treatment of the underlying cause
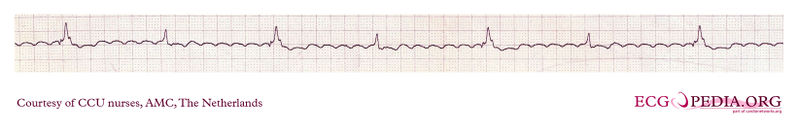
Atrial Fibrillation (AFib) (89):
- Rate: varies
- Atrial rate 400-600 bpm
- Ventricular rate 75-175 bpm
- Anything over 100 is considered A Fib with rapid ventricular response (RVR)
- Conduction:
- PR interval varies
- QRS width 60-100ms
- P wave morphology:
- The maximum height of the P wave is:
- Lead II and III: 2.5 mm
- Rhythm Strip:
- A Fib
- The maximum height of the P wave is:
(28)
- A Fib RVR

(34)
- Signs and Symptoms:
- None
- Palpitations
- Fatigue
- Syncope or near syncope
- Shortness of breath
- Regular or irregular pulse
- Patients can go in and out of A Fib or it can be permanent,
- They can go in and out of RVR
- Causes:
- Heart disease
- Genetics
- Pulmonary embolism or other hemodynamic stressors
- Obstructive sleep apnea
- Heart failure
- Pericarditis
- Myocarditis
- Myocardial infarction
- Hypertension
- Diabetes mellitus
- Age
- Treatment:
- None if asymptomatic
- Medications
- Cardizem
- Metoprolol
- Amiodarone
- Anticoagulation to prevent stroke
- Catheter ablation
- Treatment of the underlying cause
Idioventricular Rhythms (47):
- Rate: varies
- Idioventricular rate 35-40bpm
- Accelerated rate 60-120bpm
- Conduction:
- PR interval not present
- QRS width greater than 120ms but can be greater than 160ms
- The normal conduction system does not transmit the signal to beat, the vertical signal is transmitted from cell to cell
- P wave morphology:
- Not present
- Rhythm Strip:
- Idioventricular rate

(36)
- Signs and Symptoms:
- None
- Palpitations
- Fatigue
- Lightheadedness
- Syncope or near syncope
- Cardiac arrest
- Causes:
- Electrolyte imbalances
- Reperfusion of cardiac cells after a myocardial infarction
- Medications
- Digoxin
- Beta-adrenoreceptor agonists
- Illicit drug use like cocaine
- Cardiomyopathies
- Congenital cardiac defects
- Athletes
- Treatment:
- None if asymptomatic
- Medications
- Atropine
- Amiodarone or lidocaine
- Reversal agents
- Rarely cardiac pacing
- Treatment of the underlying cause
Junctional Rhythms (52):
- Rate: varies
- Junctional bradycardia less than 40bpm
- Junctional escape rhythm 40-60bpm
- Accelerated junctional rhythm 60-100bpm
- Junctional tachycardia greater than 100bpm
- Conduction:
- PR interval not present
- QRS width 60-100ms
- P wave morphology:
- Not present
- Rhythm Strip:
- Accelerated Junctional Rhythm
- Rhythms look the same but have more beats depending on the type of rhythm
- Accelerated Junctional Rhythm

(52)
- Signs and Symptoms:
- None
- Shortness of breath
- Palpitations, intermittent or continuous
- Fatigue
- Lightheadedness
- Syncope or near syncope
- Causes:
- Electrolyte imbalances
- Can be caused by anorexia nervosa
- Thoracic trauma
- Myocarditis
- Reperfusion of cardiac cells after a myocardial infarction
- Medications
- Adenosine
- Clonidine
- Antiarrhythmics
- Lithium
- Digoxin
- Sleep apnea
- Hypoxia
- Coronary artery disease
- Congenital cardiac defects and repairs of these defects
- Electrolyte imbalances
- Treatment:
- None if asymptomatic
- Medications
- Atropine
- Reversal agents
- Transcutaneous pacing
- Permanent pacemaker
- Treatment of the underlying cause
Bundle Branch Blocks (BBB) (43, 53, 70):
- Rate: varies
- Conduction:
- Right BBB (RBBB):
- QRS interval greater than 120ms
- Septal depolarization that leads to a:
- Small R wave being present in V1
- Q wave in V6
- The left ventricle’s contraction leads to and:
-
- S wave in V1
- R wave in V6
-
- The right ventricle’s contraction leads to an:
- R wave in V1
- Deep S wave in V6
- Left BBB (LBBB):
- QRS interval greater than 120ms
- T wave inversion is due to abnormal repolarization
- From first principles:
- Septal depolarization that leads to a:
- Q wave in V1
- R wave in V6
- Right BBB (RBBB):
-
-
- The right ventricle’s contraction leads to an:
- R wave in V1
- S wave in V6
- The left ventricle’s contraction leads to and:
- S wave in V1
- R wave in V6
- The right ventricle’s contraction leads to an:
- P wave morphology:
- The maximum height of the P wave is:
- Lead II and III: 2.5 mm
- Rhythm Strip:
- RBBB
- The maximum height of the P wave is:
-
(71)
-
-
-
- LBBB
-
-
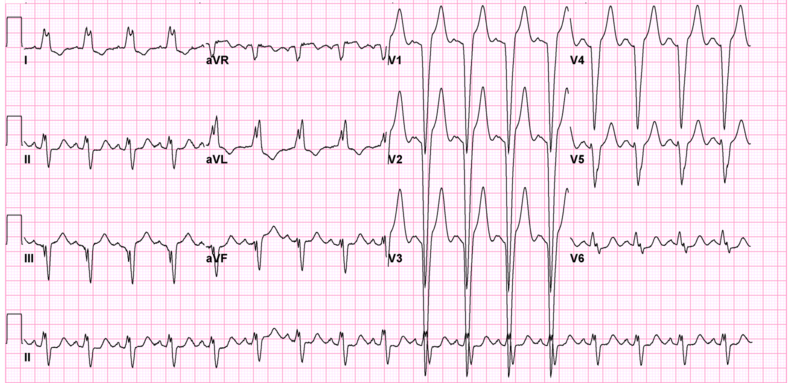
(71)
- Signs and Symptoms:
- None
- Lightheadedness
- Syncope or near syncope
- Causes:
- RBBB:
- Myocardial infarction
- Congenital cardiac defects
- Pulmonary embolism
- Myocarditis
- Pulmonary hypertension
- LBBB:
- Myocardial infarction
- Hypertension
- Cardiomyopathy
- Myocarditis
- Treatment:
- None if asymptomatic
- Treatment of the underlying cause
- RBBB:
Identifying Ischemia and Infarction
Known as coronary artery disease (CAD), acute myocardial ischemia is the decrease of blood flow to the heart by atherosclerosis or plaque. The atherosclerosis starts as a plaque streak within the large arteries and continues to build up. After the plaque has grown to a significant size, occlusion begins and blood flow to areas below the growing occlusion suffers a decrease in blood flow. This is what is known as ischemia (81).
When resting, patients may not experience any signs or symptoms. Upon exertion, however, patients may experience stable angina—chest pain, discomfort, pressure, etc.—as activity requires increased blood flow and the arteries constrict to pump blood through the body faster. This pain is relieved at rest and can be further treated by nitrates. The routine is what makes this stable angina (81).
Unstable angina begins once the artery has become occluded enough to create a significant obstruction of blood flow. Signs and symptoms can include chest pain or other discomfort that is challenging to relieve, even when at rest. Patients may be woken from sleep due to the pain and report that it takes longer for the pain to decrease or resolve completely. These signs and symptoms symbolize that the plaque within the artery is unstable and could potentially rupture (90).
Infarction is when the blood flow is completely obstructed and the cells below the obstruction begin to die off. This often occurs when the plaque within the artery ruptures, leading to the body’s natural clotting processing in an attempt to repair the rupture, and a complete occlusion of the artery occurs (46).
Now that we have discussed ischemia and infarction, it is time to discuss how a myocardial infarction (MI) appears on an EKG and how to identify it. You may also hear them referred to as STEMIs or ST-elevation myocardial infarction.
The progression of PQRST complex changes during an MI can start with hyperacute T waves. The T wave will increase with amplitude and become wider, while some ST elevation may be noted. This elevation begins to occur as injury to the heart muscle begins. From there, the ST elevation increases and creates the image often associated with an MI. Pathological Q wave may develop as the MI progresses. As discussed earlier, the Q wave is the first downward deflection of the QRS complex and is normally 1mm or less in depth. Pathological Q waves are measured by greater than 1mm wide or greater than 25% of the R wave’s amplitude (84).
T wave inversion occurs when the cells have become necrotized and begin to form fibrosis. Once all necrotized cells have become fibrotic, the Q waves will remain, but the T waves will become upright again (84).
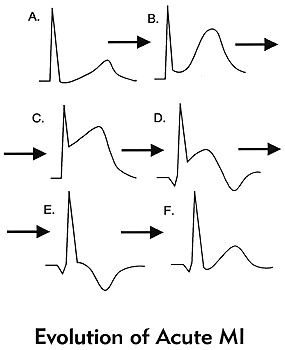
(84)
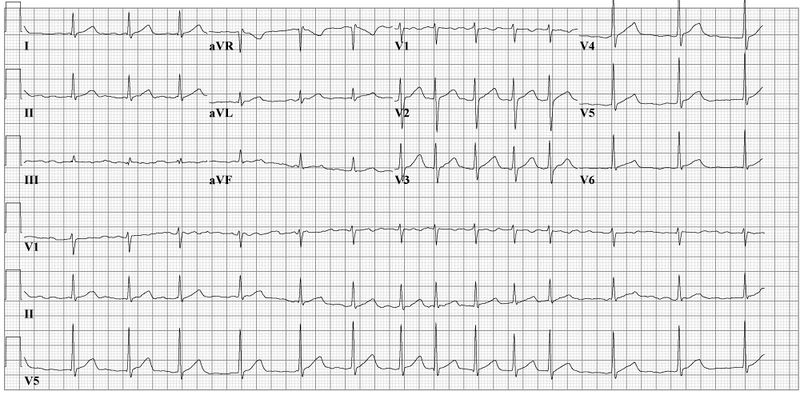
These changes should be present in at least 2 contiguous leads or leads that are side by side. To discuss this more, we will refer to the 12 lead EKG photo we used earlier. It is important to know that there will be leads with ST elevation and there will be leads with reciprocal ST depression based on the type of MI and how these leads are placed in relation to the area of the heart that is being affected.
| Type of MI | Leads with ST Elevation | Reciprocal ST Depression |
| Inferior | I, II, AVF | I, AVL |
| Lateral | V5, V6 | III, AVR |
| Anterior | I, AVL, V5, V6 | II, III, AVF |
| Posterior | V7, V8, V9 | V1, V2, V3 |
(82)
With posterior MIs the elevation must be at least 0.5mm, there will be tall, broad R waves of at least 30ms long, and the T wave will be upright. When looking at an EKG for a posterior MI, the ST depression is what will be observed in leads V1, V2, and V3. If a posterior MI is suspected, look at the EKG from the back of the paper by flipping it over and holding it to light. This will display the ST depression as ST elevation, prompting you to consider a posterior EKG. It is advised that a posterior EKG with leads V7, V8, and V9 be done. A quick method to do this is by removing leads V4, V5, and V6; placing them in the posterior lead positions; and relabeling them on the EKG. (77).
Right ventricular MIs can occur, and it is important to assess and treat them appropriately. To assess for a right-sided MI, first look at the standard EKG. If ST elevation is noted in leads II and III, but the ST elevation is greater in lead III than lead II, consider right ventricular involvement. As discussed previously, one method is to do a right-sided EKG, with lead placement along the right side of the chest. The second, quicker way to do this is to take lead V4 and place it on the right side of the chest and mark it as V4R on the EKG (77).
Another rhythm that can be an indicator of an MI is a bundle branch block. New or suspected new BBBs are to be treated as a MI by providers. But what if you have a copy of an old EKG and the BBB isn’t new, can the patient still be having an MI? The answer is yes. However, it can be challenging to determine what is a change from the MI and what is from the BBB. The Sgarbossa criteria is useful in making these determinations and can also be used for patients who have a pacemaker (77)
Sgarbossa criteria (77):
- Concordant ST elevation that is greater than 1mm
- Concordant ST depression that is greater than 1mm
- Excess discordant ST elevation that is greater than 5mm in leads with negative QRS complexes – these are complexes below the isoelectric line
For reference, concordance means that the ST segment and QRS complex go in the same direction, either both deflecting upwards or downwards. Discordance is what should be seen in a BBB or paced rhythm. This is where the ST segment and the QRS complex go in different directions. Smith et al. created a modification to the Sgarbossa criteria to include a greater than 1mm ST elevation to an S-wave amplitude ratio of greater than 0.25mm (7).
Another method that has been created, but not validated is the Barcelona criteria. This criterion has greater than 1mm ST deviation concordance or discordance with QRS polarity in any EKG lead. Discordant ST deviation is greater than 1mm in any lead where the R or S points of the QRS complex are less than 6mm (7).
There is an EKG rhythm that can indicate a future MI which is known as Wellens syndrome. This EKG has a deeply inverted or biphasic T wave in leads V2 and V3. The patient is often pain-free when the rhythm is present, ischemic chest pain can obscure the rhythm by creating a false normal appearance of the T waves in the affected leads. Their cardiac enzymes may not even be elevated. Any patient presenting with chest pain should have serial EKGs done for this reason, since they may be pain-free at a later time. These EKG changes symbolize the critical stenosis of the proximal left anterior descending artery (LAD). This is the artery that provides the left ventricle with blood (65).
Self Quiz
Ask yourself...
- Do you remember the first patient that you had that was experiencing an MI? What stood out about that patient in your mind?
- Patients have a variety of symptoms that can be experienced during an MI, what was the most interesting symptom a patient had during an MI?
- Have you ever encountered a patient with Wellens Syndrome? Do you know if they ended up having an MI later?
Cardiac Assessment:
A traditional cardiac assessment focuses on more than just the heart; it encompasses aspects of both the neurological and respiratory systems. However, we will begin our focus with the heart.
Pain may not be a word patients use to describe what they are feeling. As mentioned, they may vocalize discomfort, pressure, cramping, burning, or tightness. Women may have jaw or arm pain as opposed to the traditional chest pain that men may experience. Ask them to rate their pain on a scale of one to ten, looking for changes in the value. An EKG based on pain, discomfort, pressure, cramping, or tightness should be completed within the time frame set by hospital policy.
The PQRST pneumonic can assist providers in remembering the specific information they need to collect (90).
P: What provokes, precipitates, or palliates/alleviates the pain or discomfort the patient is feeling? Does it get worse or better when you do certain things, i.e., walk or rest?
Q: What is the quality of pain or discomfort you are feeling?
R: Does this pain or discomfort radiate anywhere else in your body? Jaw, arm, back?
S: Are there associated symptoms with the pain or discomfort? Shortness of breath, dizziness, heartburn?
T: What time elements are involved? When did it start? Did it stop and come back? Are you currently feeling it now? Was it gradual or did it occur suddenly? Did it wake you up?
Patients should be asked about palpitations or any experienced abnormal heart rhythms detected on monitoring devices. Many individuals have smartwatches that can detect heart rates and some rhythms. If the patient is wearing one, determine if the device has recorded anything.
Edema in the legs can be a sign of acute heart failure while pain in the calf can indicate a blood clot that could have traveled from another part of the body (85). In A Fib, the blood can clot in the ventricles due to poor circulation of blood. It will pool until it clots or is ejected from the heart. Once expelled, the clot will travel until it can no longer pass through the veins (63). Ensure a thorough assessment of the patient’s distal pulses is done as well to determine circulation. The further pulse locations can be an indicator of poor circulation (85).
Moving on to the respiratory system, we will reflect on the many arrhythmias that have shortness of breath as a sign or symptom. Providers should assess lung sounds to determine if there is any fluid buildup, a sign of acute heart failure. Determine if the shortness of breath is all the time, upon exertion, or at rest. Also, it is important to ask if the patient has been woken from sleep due to a shortness of breath. Sometimes arrhythmias occur at unexpected moments, even in the middle of the night (85).
Syncope was another common sign or symptom of cardiac arrhythmias due to decreased perfusion to the brain. Providers should determine if the patient currently feels lightheaded or dizzy, if they felt that way in the past, or if they have fainted. They should ask when this feeling happens—at rest, while moving, or both—and if they get any warning signs or auras beforehand. Always ensure you ask the patient to describe what happened so it can be added to the assessment (85).
A full medical history should be obtained, with a special focus on any past cardiac medical history the patient or their family has. Providers may consider asking the following questions:
- Have you been diagnosed with coronary artery disease, high blood pressure, peripheral vascular disease, valve problems, heart failure, high cholesterol, or other heart conditions?
- Have you had a heart attack or stroke in the past?
- Have you had any surgical procedures to help with your heart function? This may include things like ablation or stent placement.
Asking about medications can assist providers in determining any missed diagnoses with the patient while asking about social history can provide information about smoking, illicit drug use, alcohol consumption, and exercise habits (85).
Self Quiz
Ask yourself...
- Have you seen changes in the patients admitted to your facilities that you could correlate to these indications?
- Do you agree with this list? Is there anything you feel should be added or removed? Why?
- Are there any time frames (how long a patient is on a telemetry monitor) that you think should be adjusted?
- Do you think sending patients home with wearable monitors could be used in the future to prevent admission in some of the patients who meet the criteria for admission with telemetry?
Conclusion
Thanks to advancements within the medical profession, cardiac telemetry can be greatly beneficial to patients in and outside of the hospital setting. From devices you can carry, to devices implanted inside someone, patient outcomes have improved for identifying, treating, and managing cardiac arrhythmias that had once been deemed unmanageable. With proper knowledge of EKG rhythms, nurses can confidently provide the proper care for their patients by being an advocate for those they care for.
References + Disclaimer
- AlGhatrif, M., & Lindsay, J. (2012). A brief review: History to understand fundamentals of electrocardiography. Journal of Community Hospital Internal Medicine Perspectives, 2(1), 14383. https://doi.org/10.3402/jchimp.v2i1.14383
- Alila Medical Media. (2017). Cardiac action potential, animation. [YouTube Video]. In YouTube. https://www.youtube.com/watch?v=v7Q9BrNfIpQ
- American Heart Association. (2016). Ventricular fibrillation. Www.heart.org. https://www.heart.org/en/health-topics/arrhythmia/about-arrhythmia/ventricular-fibrillation
- Atkielski, A. (2023). PQRST segment. In StatPearls. https://www.ncbi.nlm.nih.gov/books/NBK551635/figure/article-20939.image.f1/?report=objectonly
- Benzoni, T., & Cascella, M. (2021). Procedural sedation. PubMed; StatPearls Publishing. https://www.ncbi.nlm.nih.gov/books/NBK551685/
- Bern Dibner. (2018). Luigi Galvani | Italian physician and physicist. In Encyclopædia Britannica. https://www.britannica.com/biography/Luigi-Galvani
- Birnbaum, Y., Ye, Y., Smith, S. W., & Jneid, H. (2021). Rapid diagnosis of STEMI equivalent in patients with left bundle‐branch block: Is it feasible? Journal of the American Heart Association, 10(18). https://doi.org/10.1161/jaha.121.023275
- Bracey, A. (2023). Posterior MI. In nlm.nih.gov. https://www.ncbi.nlm.nih.gov/books/NBK553168/figure/article-698.image.f1/?report=objectonly
- Burns, E., & Buttner, R. (2021). PVCs. In com. https://litfl.com/premature-ventricular-complex-pvc-ecg-library/
- Burns, E., & Buttner, R. (2023a). Anterior MI. In com. https://litfl.com/anterior-myocardial-infarction-ecg-library/)
- Burns, E., & Buttner, R. (2023b). Monomorphic vtach. In com. https://litfl.com/ventricular-tachycardia-monomorphic-ecg-library/
- Burns, E., & Buttner, R. (2023c). Torsades de Pointes. In com. https://litfl.com/polymorphic-vt-and-torsades-de-pointes-tdp/
- Cadogan, M. (2018, August 1). Delta wave. Life in the Fast Lane. https://litfl.com/delta-wave-ecg-library/
- Cadogan, M. (2022). Lead positioning. In com. https://litfl.com/ecg-lead-positioning/
- Cardiac Science. (2021). ECG graph paper. In ca. https://cardiacsciencesmb.ca/ecg-graph-paper/
- Cardogan, M., & Buttner, R. (2021). Sgarbossa criteria. In com. https://litfl.com/sgarbossa-criteria-ecg-library
- Cascino, T., & Shea, M. (2022, September). Electrocardiography – cardiovascular disorders. MSD Manual Professional Edition. https://www.msdmanuals.com/professional/cardiovascular-disorders/cardiovascular-tests-and-procedures/electrocardiography
- Center for Advanced Cardiac and Vascular Interventions. (2023). Mobile cardiac telemetry (MCT). Center for Advanced Cardiac and Vascular Interventions. https://cacvi.org/services/diagnostic-procedures/mobile-cardiac-telemetry/
- Center for Drug Evaluation and Research. (2021, January 8). FDA drug safety communication: New information regarding QT prolongation with ondansetron (zofran). https://www.fda.gov/drugs/drug-safety-and-availability/fda-drug-safety-communication-new-information-regarding-qt-prolongation-ondansetron-zofran
- Chruścik, A., Kauter, K., Windus, L., & Whiteside, E. (2021). 6.2 cardiac muscle and electrical activity. In pressbooks.pub. University of Southern Queensland. https://usq.pressbooks.pub/anatomy/chapter/6-2-cardiac-muscle-and-electrical-activity/
- Cleveland Clinic. (2022a). Asystole. In clevelandclinic.org. https://my.clevelandclinic.org/health/symptoms/22920-asystole
- Cleveland Clinic. (2022b, June 3). Pulseless electrical activity (PEA): Causes and treatment. Cleveland Clinic. https://my.clevelandclinic.org/health/symptoms/23213-pulseless-electrical-activity
- Cleveland Clinic. (2022c, June 11). Cardiac event monitor: Types and uses. Cleveland Clinic. https://my.clevelandclinic.org/health/diagnostics/23272-cardiac-event-monitor
- Clip Art Library. (2023). EKG machine. In https://clipart-library.com/clipart/2049261.htm.
- Cohagan, B., & Dov Brandis. (2019, February 17). Torsade de Pointes. Nih.gov; StatPearls Publishing. https://www.ncbi.nlm.nih.gov/books/NBK459388/
- Costa, C. (2016). Figure 2.1: A) basic cardiac anatomy and blood circulation through the… In ResearchGate. ResearchGate. https://www.researchgate.net/figure/A-Basic-cardiac-anatomy-and-blood-circulation-through-the-hearts-cavities-and-valves_fig20_320411039
- de Jong, J. (2007a). 2nd AV block. In org. https://en.ecgpedia.org/index.php?title=File:Wenckebach2.png
- de Jong, J. (2007b). A fib. In org. https://en.ecgpedia.org/index.php?title=File:Afib_ecg.jpg
- de Jong, J. (2007c). Normal sinus rhythm. In org. https://en.ecgpedia.org/index.php?title=File:Nsr.jpg
- de Jong, J. (2008). SVT. In org. https://en.ecgpedia.org/index.php?title=File:Avrt_small.svg
- de Jong, J. (2009). A flutter. In org. https://en.ecgpedia.org/index.php?title=File:ECG000011.jpg
- de Jong, J. (2010a). 1st AV block. In org. https://en.ecgpedia.org/index.php?title=File:Rhythm_1stAVblock.png
- de Jong, J. (2010b). 3rd AV block. In org. https://en.ecgpedia.org/index.php?title=File:Rhythm_3rdAVblock.png
- de Jong, J. (2010c). A fib RVR. In org. https://en.ecgpedia.org/index.php?title=File:Afib_f_VR_ecg.jpg
- de Jong, J. (2010d). Bigeminy PVC. In org. https://en.ecgpedia.org/index.php?title=File:Rhythm_bigemini.png
- de Jong, J. (2010e). Idioventricular rhythm. In org. https://en.ecgpedia.org/index.php?title=File:Rhythm_idioventricular.png
- de Jong, J. (2010f). PAC. In org. https://en.ecgpedia.org/index.php?title=File:Rhythm_premature.png
- de Jong, J. (2010g). PVCs. In org. https://en.ecgpedia.org/index.php?title=File:Rhythm_ventricular_premature.png
- de Jong, J. (2010h). Ventricular fibrillation. In org. https://en.ecgpedia.org/index.php?title=File:Rhythm_ventricular_fibrillation.png
- de Jong, J. (2011a). Mobitz. In org. https://en.ecgpedia.org/index.php?title=File:Rhythm_Mobitz.png
- de Jong, J. (2011b, December 13). Normal tracing. En.ecgpedia.org. https://en.ecgpedia.org/index.php?title=Normal_Tracing
- de Jong, J. (2011c). Sinus tachycardia. In org. https://en.ecgpedia.org/index.php?title=File:Rhythm_tachycardia.png
- Dmitriy Scherbak, & Hicks, G. J. (2019, April 7). Left bundle branch block (LBBB). Nih.gov; StatPearls Publishing. https://www.ncbi.nlm.nih.gov/books/NBK482167/
- Douedi, S., & Douedi, H. (2020). P wave. PubMed; StatPearls Publishing. https://www.ncbi.nlm.nih.gov/books/NBK551635/
- Foth, C., Manesh Kumar Gangwani, & Alvey, H. (2020, January 13). Ventricular Tachycardia (VT, V Tach). Nih.gov; StatPearls Publishing. https://www.ncbi.nlm.nih.gov/books/NBK532954/
- Foth, C., & Mountfort, S. (2022). Acute myocardial infarction ST elevation (STEMI). National Library of Medicine; StatPearls Publishing. https://www.ncbi.nlm.nih.gov/books/NBK532281/
- Gangwani, M. K., & Nagalli, S. (2020). Idioventricular rhythm. PubMed; StatPearls Publishing. https://www.ncbi.nlm.nih.gov/books/NBK554520/
- GE HealthCare. (2023a). Apexpro ch telemetry system patient monitors. Www.gehealthcare.com. https://www.gehealthcare.com/products/patient-monitoring/patient-monitors/apexpro-ch-telemetry-system
- GE HealthCare. (2023b). Cardiac beside monitor. In com. https://www.gehealthcare.com/products/patient-monitoring/patient-monitors/carescape-monitor-b650
- Glenlarson . (2023). Inferior MI. In nlm.nih.gov. https://www.ncbi.nlm.nih.gov/books/NBK470572/figure/article-23500.image.f1/?report=objectonly
- Gray, D. (2016). How to read an electrocardiogram (EKG/ECG) (K. Gaines , Ed.). Nurse.org. https://nurse.org/articles/how-to-read-an-ECG-or-EKG-electrocardiogram/
- Hafeez, Y., & Grossman, S. A. (2020). Junctional rhythm. PubMed; StatPearls Publishing. https://www.ncbi.nlm.nih.gov/books/NBK507715/
- Harkness, W. T., & Hicks, M. (2019, June 3). Right bundle branch block (RBBB). Nih.gov; StatPearls Publishing. https://www.ncbi.nlm.nih.gov/books/NBK507872/
- Heaton, J., & Yandrapalli, S. (2021). Premature atrial contractions. PubMed; StatPearls Publishing. https://www.ncbi.nlm.nih.gov/books/NBK559204/
- Henning, A., & Krawiec, C. (2022, August 8). Sinus tachycardia. PubMed; StatPearls Publishing. https://www.ncbi.nlm.nih.gov/books/NBK553128/
- Ibrahim, H. (2022a, May 19). ECG tip 20. what about “orthodromic” SVT?youtube.com. https://www.youtube.com/watch?v=XcnU7mGKdis
- Ibrahim, H. (2022b, May 24). ECG tip 21. what about “antidromic” SVT?youtube.com. https://www.youtube.com/watch?v=qTaNeoGEKJc
- Johns Hopkins Medicine. (2019). Holter monitor. John Hopkins Medicine. https://www.hopkinsmedicine.org/health/treatment-tests-and-therapies/holter-monitor
- Jordan, M. R., Lopez, R. A., & Morrisonponce, D. (2020). Asystole. PubMed; StatPearls Publishing. https://www.ncbi.nlm.nih.gov/books/NBK430866/
- Mangi, M. A., Jones, W. M., & Napier, L. (2019, November 6). Atrioventricular block second-degree. Nih.gov; StatPearls Publishing. https://www.ncbi.nlm.nih.gov/books/NBK482359/
- Mayo Clinic. (2017). Implantable cardioverter-defibrillators (ICDs). Mayoclinic.org. https://www.mayoclinic.org/tests-procedures/implantable-cardioverter-defibrillators/about/pac-20384692
- Mayo Clinic. (2019). Acute coronary syndrome – symptoms and causes. Mayo Clinic. https://www.mayoclinic.org/diseases-conditions/acute-coronary-syndrome/symptoms-causes/syc-20352136
- Mayo Clinic. (2023, July 26). Atrial fibrillation – symptoms and causes. Mayo Clinic. https://www.mayoclinic.org/diseases-conditions/atrial-fibrillation/symptoms-causes/syc-20350624
- McMurray, P. (2018). PVCs multiform. In com. https://bossrn.com/pvc
- Miner, B., Grigg, W. S., & Hart, E. H. (2020a). Wellens syndrome. PubMed; StatPearls Publishing. https://www.ncbi.nlm.nih.gov/books/NBK482490/
- Mountfort, S. (2023). Lateral MI. In nlm.nih.gov. https://www.ncbi.nlm.nih.gov/books/NBK537228/figure/article-24110.image.f2/?report=objectonly
- National Heart, Lung, and Blood Institute. (2022). Atherosclerosis . In nih.gov. https://www.nhlbi.nih.gov/health/atherosclerosis
- Oldroyd, S. H., & Makaryus, A. N. (2020). First degree heart block. PubMed; StatPearls Publishing. https://www.ncbi.nlm.nih.gov/books/NBK448164/
- Osmosis by Elsevier. (2023). Cardiac electrophysiology notes: Diagrams & illustrations. Www.osmosis.org. https://www.osmosis.org/notes/Cardiac_Electrophysiology#page-1
- Oxford Medical Education. (n.d.). ECG (EKG) – bundle branch block. Oxford Medical Education. https://oxfordmedicaleducation.com/ecgs/bundle-branch-block/
- Parker, S. (n.d.). Telemetry – MeSH – NCBI. Www.ncbi.nlm.nih.gov. Retrieved September 8, 2023, from https://www.ncbi.nlm.nih.gov/mesh/?term=telemetry
- Patti, L., & Ashurst, J. V. (2019, June 4). Supraventricular tachycardia (SVT). Nih.gov; StatPearls Publishing. https://www.ncbi.nlm.nih.gov/books/NBK441972/
- Rodriguez Ziccardi, M., Goyal, A., & Maani, C. V. (2020). Atrial flutter. PubMed; StatPearls Publishing. https://www.ncbi.nlm.nih.gov/books/NBK540985/
- RWJ Barnabas Health. (2023). Telemetry monitor technician. In org. https://www.rwjbh.org/community-medical-center/treatment-care/heart-and-vascular-care/programs-and-specialties/centralized-cardiac-telemetry-monitoring-program/
- Sandau, K. E., Funk, M., Auerbach, A., Barsness, G. W., Blum, K., Cvach, M., Lampert, R., May, J. L., McDaniel, G. M., Perez, M. V., Sendelbach, S., Sommargren, C. E., & Wang, P. J. (2017). Update to practice standards for electrocardiographic monitoring in hospital settings: A scientific statement from the American Heart Association. Circulation, 136(19). https://doi.org/10.1161/cir.0000000000000527
- Sattar, Y. (2023). Lead placement. In StatPearls. https://www.ncbi.nlm.nih.gov/books/NBK549803/figure/article-20969.image.f1/?report=objectonly
- Sklavos, T. (2020, November 3). ECG interpretation: Myocardial ischaemia and infarction. LITFL. https://litfl.com/ecg-interpretation-myocardial-ischaemia-and-infarction/
- Slane, M., Knabben, V., & Chhabra, L. (2019). Third-Degree atrioventricular block. Nih.gov; StatPearls Publishing. https://www.ncbi.nlm.nih.gov/books/NBK545199/
- Smith, S. (2014). Wide complex SVT. In hqmeded-ecg.blogspot.com. https://hqmeded-ecg.blogspot.com/2014/12/wide-complex-tachycardia-lewis-leads-do.html
- Vincent’s Hospital. (n.d.). Holter monitor. In svhhearthealth.com.au. https://www.svhhearthealth.com.au/Images/UserUploadedImages/976/10_HolterMonitor.jpg
- Thanassoulis, G., & Aziz, H. (2018). Atherosclerosis. Merck Manuals Professional Edition; Merck Manuals. https://www.merckmanuals.com/professional/cardiovascular-disorders/arteriosclerosis/atherosclerosis
- The Univeristy of Nottingham. (n.d.-a). Bipolar Leads. Www.nottingham.ac.uk. https://www.nottingham.ac.uk/nursing/practice/resources/cardiology/function/bipolar_leads.php
- The University of Nottingham. (n.d.-b). Limb leads. Www.nottingham.ac.uk. https://www.nottingham.ac.uk/nursing/practice/resources/cardiology/function/limb_leads.php
- University of Utah Health. (n.d.). ECG learning center – an introduction to clinical electrocardiography. Utah.edu. https://ecg.utah.edu/lesson/9
- Wisconsin Technical College System. (2021). 3 cardiovascular assessment. Wtcs.pressbooks.pub. https://wtcs.pressbooks.pub/nursingskills/chapter/9-3-cardiovascular-assessment/
- Wong, E. (2013). Action potential of cardiac muscles. In org. http://www.pathophys.org/physiology-of-cardiac-conduction-and-contractility/actionpotential/
- Yamama Hafeez, & Grossman, S. A. (2019, November 18). Sinus bradycardia. Nih.gov; StatPearls Publishing. https://www.ncbi.nlm.nih.gov/books/NBK493201/
- Yasar Sattar, & Hashmi, M. F. (2019, December 3). Ventricular premature complexes. Nih.gov; StatPearls Publishing. https://www.ncbi.nlm.nih.gov/books/NBK547713/
- Zeid Nesheiwat, Amandeep Goyal, & Mandar Jagtap. (2022). Atrial fibrillation . Nih.gov; StatPearls Publishing. https://www.ncbi.nlm.nih.gov/books/NBK526072/
- Zimmermann, P., & Hammond, B. (2023). Sheehy’s manual of emergency care. (8th ed.). Elsevier Health Sciences.
- ZOLL Medical Corporation. (2023). X series cardiac monitor/defibrillator for EMS – ZOLL medical. Www.zoll.com. https://www.zoll.com/products/defibrillators/x-series-for-ems
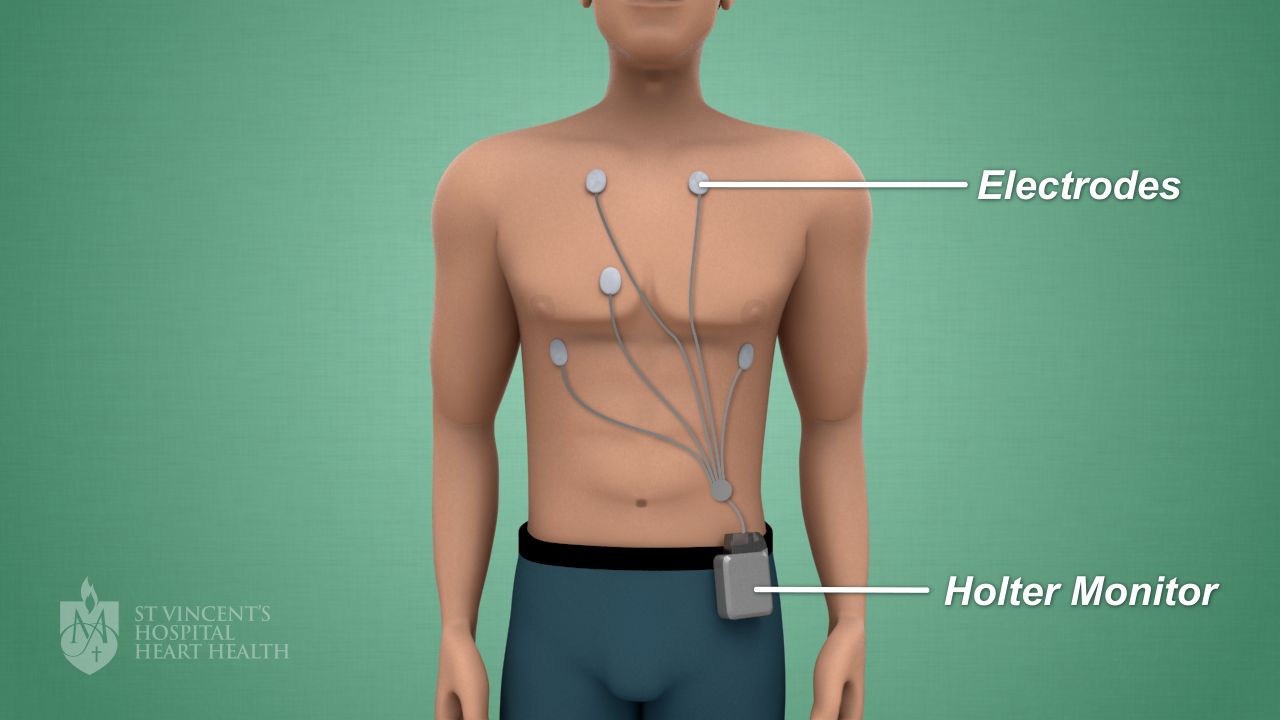
Disclaimer:
Use of Course Content. The courses provided by NCC are based on industry knowledge and input from professional nurses, experts, practitioners, and other individuals and institutions. The information presented in this course is intended solely for the use of healthcare professionals taking this course, for credit, from NCC. The information is designed to assist healthcare professionals, including nurses, in addressing issues associated with healthcare. The information provided in this course is general in nature and is not designed to address any specific situation. This publication in no way absolves facilities of their responsibility for the appropriate orientation of healthcare professionals. Hospitals or other organizations using this publication as a part of their own orientation processes should review the contents of this publication to ensure accuracy and compliance before using this publication. Knowledge, procedures or insight gained from the Student in the course of taking classes provided by NCC may be used at the Student’s discretion during their course of work or otherwise in a professional capacity. The Student understands and agrees that NCC shall not be held liable for any acts, errors, advice or omissions provided by the Student based on knowledge or advice acquired by NCC. The Student is solely responsible for his/her own actions, even if information and/or education was acquired from a NCC course pertaining to that action or actions. By clicking “complete” you are agreeing to these terms of use.
➁ Complete Survey
Give us your thoughts and feedback
➂ Click Complete
To receive your certificate